Figure 1.

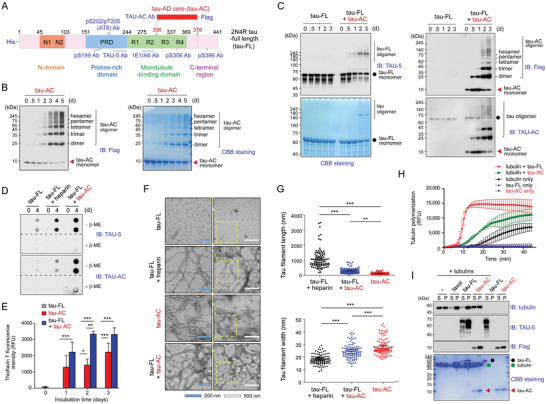
In vitro self‐aggregation and seeding of the Alzheimer's disease tau aggregation core (tau‐AC). A) Schematic diagram depicting the domains of full‐length tau (tau‐FL), tau‐AC (residues 306–378), and locations of antibody epitopes. B) The evaluation of tau‐AC self‐aggregation propensity in the absence of inducers. The FLAG‐tagged recombinant tau‐AC (100 µm) was incubated at 37 °C on a rotating shaker (250 rpm) for indicated time periods and then analyzed using non‐reducing SDS‐PAGE followed by immunoblotting (IB) with anti‐FLAG antibodies (left) and Coomassie Brilliant Blue (CBB) staining (right). Representative blots from two independent experiments are shown. C) Seeding ability of tau‐AC. Recombinant tau‐FL (20 µm) was incubated alone or with tau‐AC (20 µm) at 37 °C with agitation for indicated time periods. Induction of tau‐FL aggregation by tau‐AC was evaluated by IB using TAU‐5 antibodies and CBB staining (left). Self‐aggregation of tau‐AC was detected using anti‐FLAG and TAU‐AC antibodies (right). Representative blots from four independent experiments. D) Tau‐FL (20 µm) was incubated with either heparin (80 µm) or tau‐AC (20 µm) for 4 days. The samples were loaded and filtered into each well of a 96‐well plate in the absence or presence of 5% β‐mercaptoethanol (β‐ME). The trapped tau oligomers loaded onto the cellulose acetate membrane were detected by IB using TAU‐5 (for tau‐FL) and TAU‐AC antibodies. E) The samples from the fibrillization reactions performed with 10 μm of tau‐AC and 20 μm of tau‐FL for the indicated time periods were incubated with thioflavin T, and fluorescence intensity at 485 nm was measured. Error bars represent standard errors of the mean. RFU, relative fluorescence unit. ***p < 0.001 (n = 4, two‐way ANOVA with the Bonferroni post‐hoc test); n.s., not significant. F) Representative images of negatively stained tau filaments were observed by transmission electron microscopy (TEM). Tau‐FL (20 µm) and tau‐AC (20 µm) were incubated for 2 days at 37 °C. Insets are enlarged images of the enclosed area. White and blue scale bars represent 500 and 200 nm, respectively. G) Quantification of data presented in (F). The length and width of tau filaments were plotted as the mean ± SD. ***p < 0.001 (n = 100/group, one‐way ANOVA followed by the Bonferroni post‐hoc test). *p < 0.05, **p < 0.01, ***p < 0.001. H) Tubulin monomers (80 μm) were polymerized in the presence of tau‐FL or tau‐AC (10/1 molar ratio of tubulin/tau) in a GTP‐containing buffer at 37 °C. Microtubule assembly was kinetically monitored by the fluorescence signal from DAPI incorporation into the microtubules (excitation/emission at 358/461 nm; n = 3). I) After the microtubule polymerization reaction, the samples were fractionated by ultracentrifugation at 68 000 × g for 20 min. Supernatants (S) and pellets (P) were subjected to SDS‐PAGE and analyzed by CBB staining and IB analysis with indicated antibodies.
