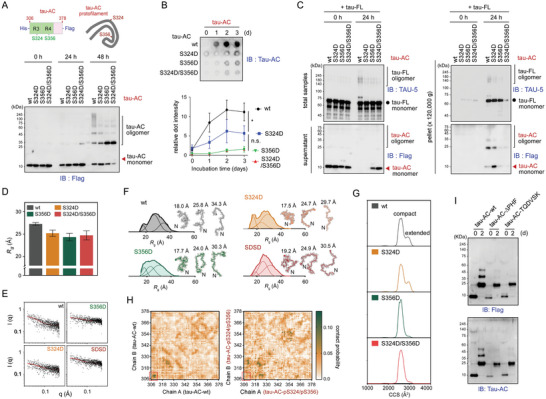
Figure 2.

Biochemical and biophysical analysis of tau‐AC self‐aggregation. A) Serines at 324 and 356 positions of tau‐AC were mutated to aspartic acids to mimic its phosphorylation (tau‐AC‐S324D, ‐S356D, and ‐S324D/S356D [SDSD] mutants; top). Wild‐type tau‐AC (tau‐AC‐wt) or phospho‐mimetic mutants (phospho‐tau‐AC; 40 µm each) were incubated at 37 °C for indicated time periods. Samples were subjected to non‐reducing SDS‐PAGE/IB (bottom). Representative blots from four independent experiments. B) The conversion of tau‐AC into insoluble aggregates was analyzed by filter trap assays over a 3‐day period. Trapped tau fibrils were detected by IB using TAU‐AC antibodies (top), quantified, and plotted as the mean ± SD (bottom); results from three independent experiments (*p < 0.05, two‐way ANOVA using the Bonferroni post‐hoc test); n.s., not significant. C) The seeding propensity of phospho‐tau‐AC. Tau‐FL (20 µm) was incubated with tau‐AC or phospho‐tau‐AC (20 µm) at 37 °C for 24 h, and the assembly reactions were ultracentrifuged at 120 000× g for 1 h to obtain supernatant and pellet fractions. The fractions were analyzed by SDS‐PAGE/IB using anti‐FLAG (for tau‐AC) and TAU‐5 (for tau‐FL) antibodies. Representative blots from two independent experiments. D) The radius of gyration (Rg ) values and Rg distribution of tau‐AC‐wt and tau‐AC‐S324D, ‐S356D, and ‐SDSD mutants were obtained from the Guinier analysis of small‐angle X‐ray scattering (SAXS) profiles. The error bars represent the standard deviation of two independent SAXS experiments. E) Raw X‐ray scattering patterns with experimental SAXS profiles (black dots) and fitted curves (red lines) obtained from the ensemble optimization method (EOM) from tau‐AC‐wt and three phospho‐mimetic mutants. F) Deconvoluted Rg distribution from the EOM analysis and the representative structures of each tau‐AC species. G) Collision cross‐section (CCS) distribution of tau‐AC‐wt and the mutants. H) Interchain contact probability maps of tau‐AC‐wt and its double phosphorylated form (pS324/pS356) from 30.4 µs molecular dynamics simulation trajectory. Red boxes indicate the 306VQIVYK311 hexapeptides located at the N‐termini of tau‐AC. I) Self‐aggregation of the tau‐AC lacking the intact PHF6 motif. The experiments were performed as described in Figure 1B, with tau‐AC mutants being used instead of tau‐AC‐wt. Representative blots from two independent experiments.
