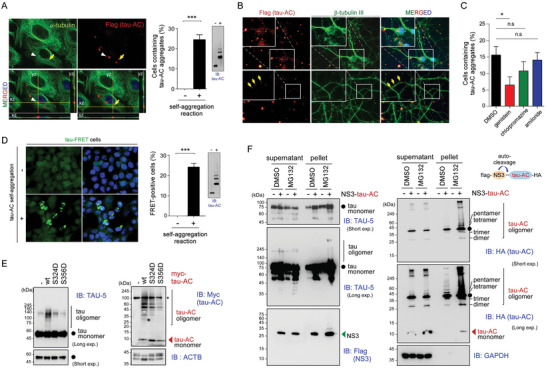
Figure 3.

Cellular uptake of tau‐AC aggregates by cell lines and primary neurons. A) (left) Representative confocal images of A549 cells cultured with tau‐ACFLAG (1 μm final concentration) before (–) and after (+) self‐aggregation reactions for 24 h. Cells were trypsinized, re‐plated onto the new glass coverslips, and then stained with anti‐FLAG and anti‐α‐tubulin antibodies. Internalized tau‐AC aggregates were imaged as Z‐stacks (X‐Z and Y‐Z cross sections). (right) The percentage of tau‐AC‐positive cells in the whole population were quantified and presented as the mean ± SD of three independent experiments. ***p < 0.001 (n > 100 cells per group, two‐tailed unpaired Student's t‐test). The tau‐AC samples were also analyzed by IB using TAU‐AC antibodies. B) Day 10 in vitro (DIV 10) primary rat hippocampal neurons were treated with self‐aggregated tau‐AC (0.1 µm) for 3 days, vigorously washed three times, and then co‐immunostained using anti‐β‐tubulin III/Tuj‐1 (for differentiating neurons) and anti‐FLAG (for tau‐AC) antibodies. Nuclei were counterstained with DAPI. Yellow arrows indicate intraneuronal tau‐AC. C) A549 cells were pre‐treated for 1 h with endocytosis inhibitors genistein (200 µm), chlorpromazine (20 µm), and amiloride (500 µm), incubated with oligomeric tau‐AC for 24 h, and then the percentage of tau‐AC‐positive cells were quantified; *p < 0.01 (n > 100 cells per group, one‐way ANOVA followed by the Bonferroni post‐hoc test); n.s., not significant. D) Förster resonance energy transfer (FRET)‐based analysis of tau‐AC seeding effects in HEK293 tau‐P301S biosensor cells. The cells were treated with 1 μm of tau‐AC before (–) and after (+) self‐aggregation for 24 h, and a relative FRET‐positive cell number was quantified. To detect the FRET signal, cells were excited with a 488 nm laser and fluorescence was captured using a 525/50 filter. Data are represented as the mean ± SD; ***p < 0.001 (n > 500 cells/group, two‐tailed unpaired Student's t‐test). E) Primary cortical rat neurons were infected with lentiviruses expressing Myc‐tagged tau‐AC and its phospho‐mimetic mutants on DIV 6. Whole‐neuron lysates were collected on DIV 13 and subjected to non‐reducing SDS‐PAGE/IB. *, non‐specific signals. F) HA‐tagged tau‐AC was fused with NS3 protease containing an auto‐cleavage site located at the junction between NS3 and tau‐AC. HEK293T cells were co‐transfected with plasmids expressing NS3‐tau‐AC and tau‐FL for 30 h and then treated with MG132 (10 μm) for additional 6 h. Cells were lysed in RIPA buffer, whole cell lysates were separated into supernatant and pellet fractions and subjected to non‐reducing (supernatants) and reducing (pellets) SDS‐PAGE/IB. Representative blots from two independent experiments.
