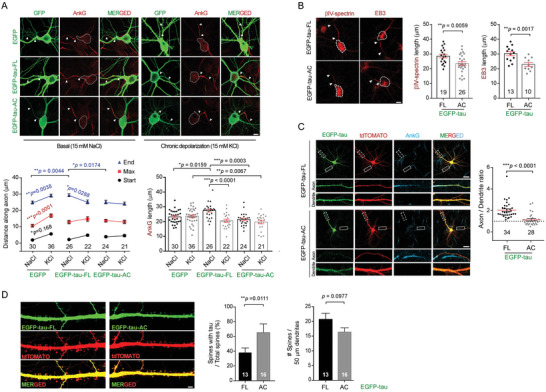
Figure 4.

Impaired AIS plasticity in primary hippocampal neurons overexpressing tau‐AC. A) Shortened AIS length in tau‐AC‐transfected neurons during chronic depolarization. EGFP‐tagged tau‐FL and tau‐AC were transiently overexpressed in DIV 10 primary hippocampal neurons. On DIV 12, the infected neurons were further treated with either 15 mm of NaCl (as controls) or KCl (for depolarization) for another 48 h. Representative confocal images (top) and quantification of AIS localization and length (bottom) are shown. The start and end points of the AIS detected by ankyrin G (AnkG) immunostaining are indicated with white arrowheads. Distances along the axon and AIS length were analyzed using two‐way ANOVA and one‐way ANOVA, respectively, followed by Tukey multiple comparison test. The number of neurons used for each quantification is shown at the bottom of the graph. Scale bar, 10 µm. B) The experiments were performed as described in (A), except that βIV‐spectrin and EB3 immunostaining was performed (left), AIS lengths were quantified (right), and data were analyzed using the unpaired Student's t‐test. The boundary of soma is shown with a white dashed line. Scale bar, 10 µm. C) Polarized trafficking is affected in neurons overexpressing tau‐AC. DIV 14 hippocampal neurons were co‐transfected with EGFP‐tau‐FL or ‐AC and tdTOMATO. After 24 h, cells were immunostained with anti‐AnkG antibody and Z‐stacked confocal microscopy images were acquired. Using the MetaMorph software, axonal and dendritic tau signals were quantified using the AnkG‐positive axon and soma‐excluded dendritic branches, respectively. Dotted‐line square, axons (20 µm from the soma). Solid‐line square, dendrites (50 µm from the soma). The results were normalized by axon to dendritic tdTOMATO signal intensities, which were obtained using the same method. Arrowheads indicate AnkG‐positive axons. ***p < 0.0001 (two‐tailed unpaired Student's t‐test). Scale bar, 25 µm. D) Effect of tau‐AC on dendritic spine density and tau localization in primary rat neurons. EGFP‐tau‐FL and ‐AC were overexpressed in DIV 13 neurons, and fluorescence signals were obtained using Z‐stacked confocal microscopy on DIV 21. Representative images and spine quantification are shown. Tau‐positive spines were determined using the semi‐automated NeuronJ program. Bars represent the percentage of tau‐positive dendritic spines and the number of total spines (mean ± SD; two‐tailed unpaired Student's t‐test). Scale bar, 5 µm.
