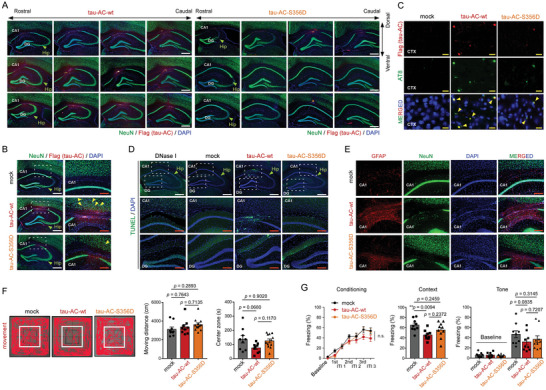
Figure 5.

Evaluation of behavioral and biochemical phenotypes of mice hippocampally injected with tau‐AC aggregates. A) Tau‐AC‐wt or ‐S356D (5 µg total/each tau species, after 6 h of in vitro oligomerization) were intra‐hippocampally injected; two months after tau‐AC injection coronal sections were prepared and co‐immunostained with anti‐NeuN and anti‐FLAG antibodies to detect neurons and tau‐AC, respectively. Nuclei were counterstained with DAPI. The ipsilateral hippocampal regions are shown. CA1, cornu ammonis 1; DG, dentate gyrus. B) Representative images of tau‐AC signal in the CA1 area of the ipsilateral hippocampus. Magnified views of boxed areas are shown on right. Yellow arrowheads indicate tau‐AC propagated into the frontal cortex area. C) Two months after the ipsilateral injection of tau‐AC‐wt or tau‐S356D, mice were sacrificed and neurofibrillary tangles in the cortex (CTX) regions were detected in the coronal sections of the brains using anti‐AT‐8 antibodies. Yellow scale bars = 20 µm. D) Apoptotic neurons in the hippocampus were visualized by the terminal deoxynucleotidyl transferase dUTP nick‐end labeling (TUNEL) assay. E) Immunostaining for glial fibrillary acidic protein (GFAP), a glial marker, which is overlapped with the NeuN‐positive signal in the CA1 layer of tau‐AC‐wt‐injected mice. White scale bars = 400 µm, red scale bars = 150 µm. F) One month after stereotaxic injection, mice were subjected to the open‐field test, and their general locomotive activity and anxiety‐like behavior were measured. Representative trace images of the open‐field test (left); the center zone is indicated with a white box. Quantification of moving distances (middle) and times in the central region (right) is shown. Data were analyzed using one‐way ANOVA followed by Tukey post‐hoc test (mock, n = 9; tau‐AC‐wt, n = 9; tau‐AC‐S356D, n = 12; Moving distance, effect of group, F2,27 = 1.194, p = 0.3185; Center zone, effect of group, F2,27 = 3.188, p = 0.0572) and presented as the mean ± SEM. G) Freezing behaviors during conditioning, contextual memory retrieval, and tone memory retrieval tasks were evaluated. Two months after tau‐AC injection, mice were trained using three pairs of acoustic tones and electric foot shocks. Freezing behavior at the baseline and in response tones and inter‐tone intervals was monitored (left: Conditioning: two‐way repeated measures ANOVA, effect of group, F2,25 = 1.979, p = 0.1593; mock, n = 9; tau‐AC‐wt, n = 9; tau‐AC‐S356D, n = 10). The next day, freezing behavior was measured in the same conditioning chamber to test contextual fear memory (middle: Context, one‐way ANOVA followed by Tukey post‐hoc test, effect of group, F2,25 = 5.214, *p = 0.0128). An auditory fear memory was examined in a novel context by measuring freezing at the baseline and in response to tones (right: Tone, two‐way ANOVA followed by Tukey post‐hoc test, effect of group, F2,25 = 1.291, p = 0.2928).
