Figure 4.
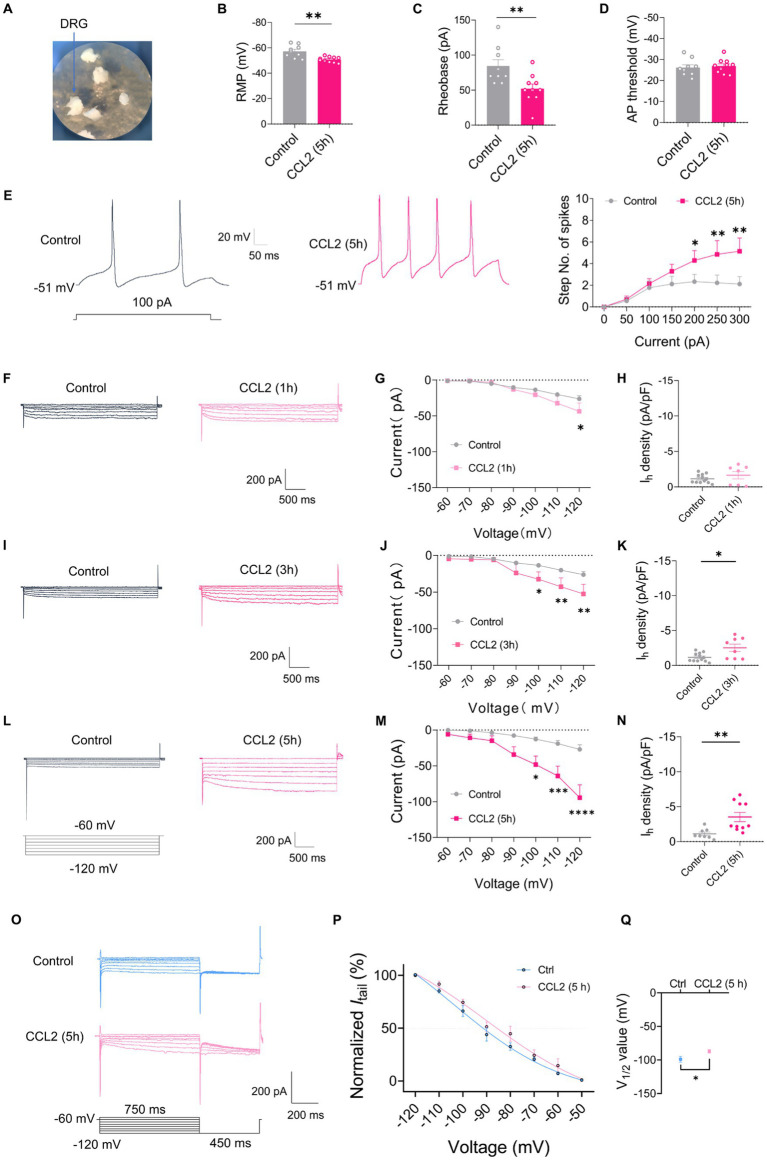
CCL2 incubation leads to elevated excitability and increased Ih currents in small diameter DRG neurons. (A) Showing intact whole mount DRG preparations and incubation of CCL2 (100 ng/mL). (B–D) Resting membrane potential (RMP) (B), rheobase (C), and AP threshold (D) of small DRG neurons both in control and 5 h after incubation with CCL2 conditions (n = 5–7, unpaired t-test). (E) Representative traces and I-O curve of small DRG neurons in response to a depolarizing current step both in control and 5 h after incubation with CCL2 conditions (n = 9, by two-way ANOVA, Fisher’s LSD test). (F,I,L) Representative traces of Ih recorded in small DRG neurons in response to hyperpolarizing voltage steps of −60 to −120 mV in 10 mV increments from a holding potential at −60 mV both in control and 1 h (F), 3 h (I), 5 h (L) incubation with CCL2 conditions. The voltage protocol is shown in the lower position of L. (G,J,M) Current–voltage relationship of Ih in small DRG neurons from control and 1 h (G, n = 10–12), 3 h (J, n = 9–12), 5 h (M, n = 8–10) incubation with CCL2 (by two-way ANOVA, Fisher’s LSD test). (H,K,N) Ih density in small DRG neurons from control and 1 h (H, n = 10–12), 3 h (K, n = 9–12), 5 h (N, n = 8–10) incubation with CCL2 conditions (by nonparametric Mann–Whitney test). (O) The activation curve of Ih from control and 5 h incubation with CCL2 was constructed by measuring tail currents at −120 mV after application of prepulse potentials between −50 to −120 mV and fitted with a Boltzmann equation. (P) The midpoint (V1/2) for activation of Ih in small DRG neurons after incubation with CCL2 5 h was shifted 12 mV in the depolarizing direction compared to control neurons. (Q) The difference of V1/2 for activation of Ih between two groups was significant changed. All data are presented as mean ± SEM. *p < 0.05, **p < 0.01, ***p < 0.001, and ****p < 0.0001.

