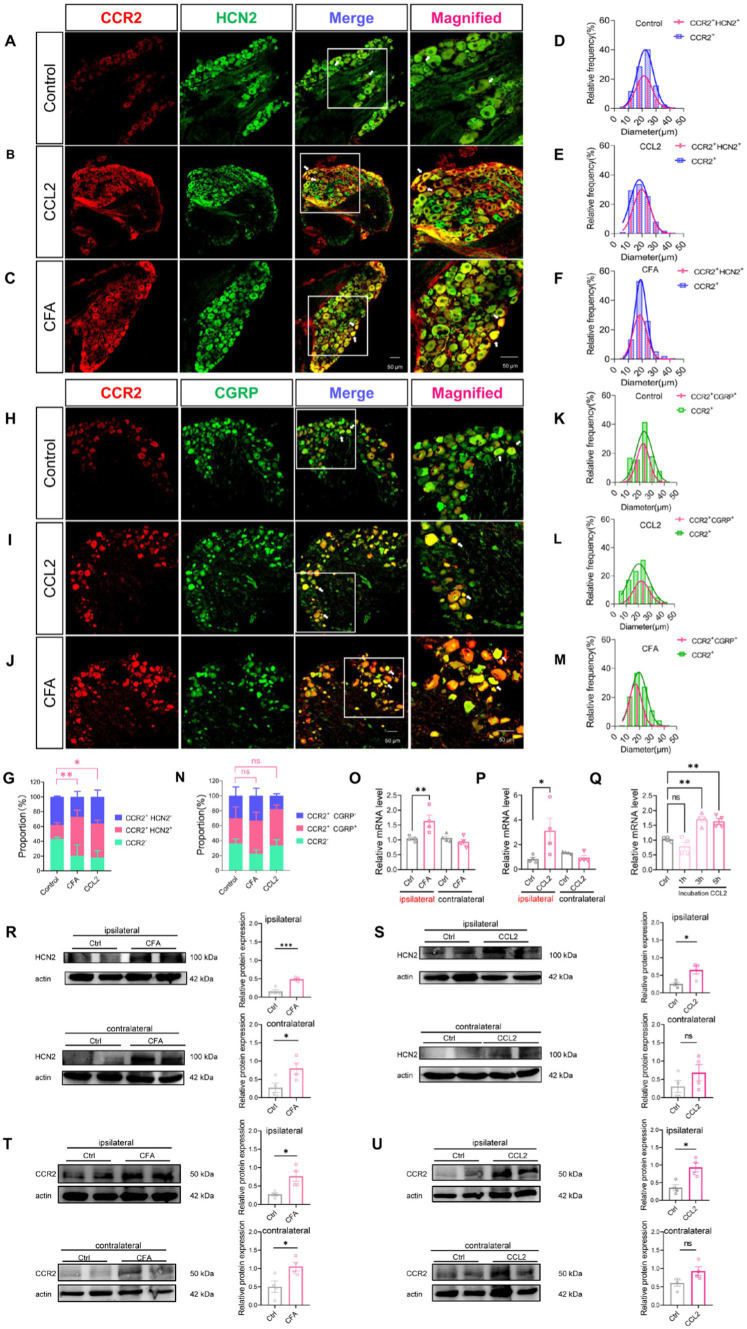
Figure 6.
CFA and CCL2 induces upregulation of CCR2, HCN2, and CGRP expression in DRG. (A–C) Representative 20× and 40× (magnified) IHC images of CCR2 (red) and HCN2 (green) in DRGs of control, DRG injection of CCL2 and intraplantar CFA injection mice. Scale bar, 50 μm. (D–F) Size distribution and CCR2+/HCN2+ co-expression characterization of CCR2-positive neurons in DRGs of control, intervertebral foramen injection CCL2 and intraplantar CFA injection mice. (H–J) Representative 20× and 40× (magnified) IHC images of CGRP (red) and CCR2 (green) in DRGs of control, intervertebral foramen injection CCL2 and intraplantar CFA injection mice. Scale bar, 50 μm. (K–M) Size distribution and CCR2+/CGRP+ co-expression characterization of CCR2-positive neurons in DRGs of control, intervertebral foramen injection CCL2 and intraplantar CFA injection mice. Note that for CFA-inflamed group, ipsilateral L4/L5 DRGs were obtained and analyzed at 24 h after intraplantar CFA injection; for CCL2-inflamed group, ipsilateral L4/L5 DRGs were obtained and analyzed at 5 h after intervertebral foramen injection CCL2. (G) Percentage of CCR2+/HCN2−, CCR2+/HCN2+, CCR2-cells in the total number of cells. Percentage of CCR2+/HCN2+ in DRG after intraplantar injection of CFA or DRG injection of CCL2 were significantly increased vs. control mice (by one-way ANOVA, Newan–Keuls test, n = 3 per group). (N) Percentage of CCR2+/CGRP−, CCR2+/CGRP+, CCR2-cells in the total number of cells (n = 3 per group). (O–Q) The mRNA expression of HCN2 was identified by RT-qPCR in 12 groups (n = 6 per group). (R) The expression of HCN2 protein in 4 groups of CFA 1 d mice (6 cases in each group) was detected by Western blot. (S) The expression of HCN2 protein in 4 groups of DRG injection of CCL2 5 h mice (6 cases in each group) were detected by Western blot. (T) The expression of CCR2 protein in 4 groups of CFA 1 d mice (6 cases in each group) was detected by Western blot. (U) The expression of CCR2 protein in 4 groups of DRG injection of CCL2 5 h mice (6 cases in each group) were detected by Western blot (by nonparametric Mann–Whitney test). CCL2 represents for DRG injection CCL2 5 h in B,E,I,L,G,N–P,S–U. All data are presented as mean ± SEM. *p < 0.05 and **p < 0.01.

