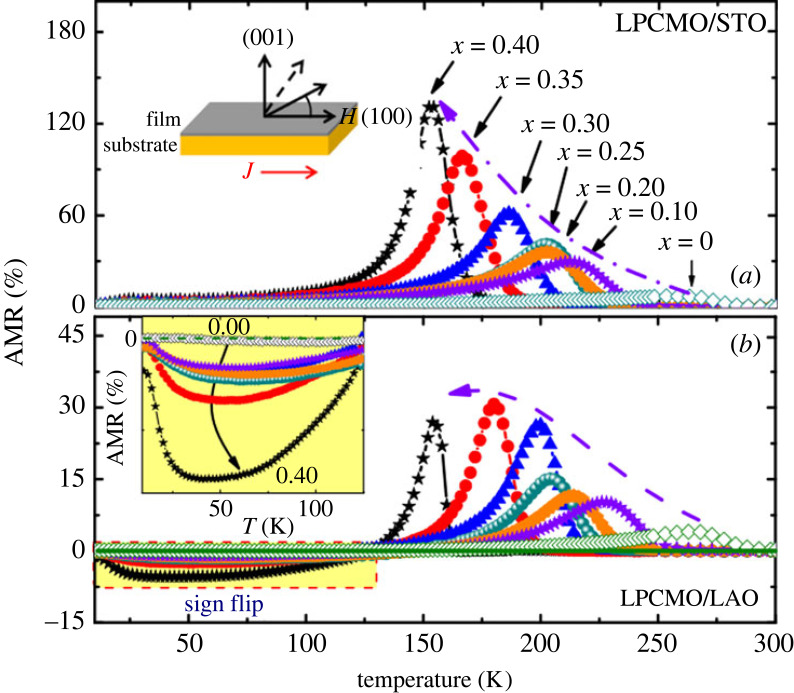
Figure 15.
AMR in La0.7−xPrxCa0.3MnO3. Temperature dependence of AMR measured in a field of 1.1 T at doping levels x = 0, 0.10, 0.20, 0.25, 0.30, 0.35 and 0.40 for films grown on (a) SrTiO3 and (b) LaAlO3 substrates. Dashed curves in both figures show the expected dependence of the AMRmax on doping. The change of sign of the AMR with increasing doping is shown in the rectangular yellow area. Insets in (a) and (b) show the direction of magnetic field H and the direction of the current J, and the expanded view of the AMR at low temperatures for LPCMO/LAO-doped films, respectively. The figure is reproduced from Alagoz et al. [48].

