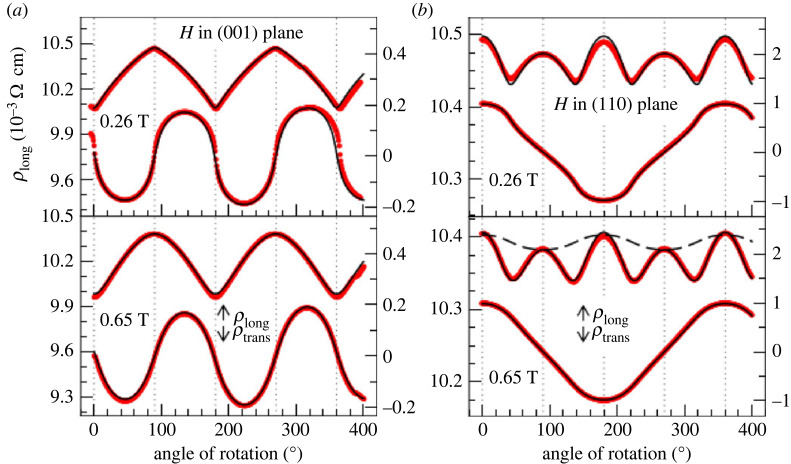
Figure 8.
The data (red thick lines) and fit (black thin line) of the longitudinal resistivity ρlong (upper line in every plot) for the current direction along [110]. The magnetic field of 0.26 and 0.65 T is rotated in the (001) and (110) plane, respectively. The dashed line in the lower panel of (b) refers to an attempt of fitting the data to cos (2ϕ), which is clearly insufficient. The lower lines in every plot are the transversal resistivity. Reproduced detail from fig. 7 in [54].

