
FIGURE 1.
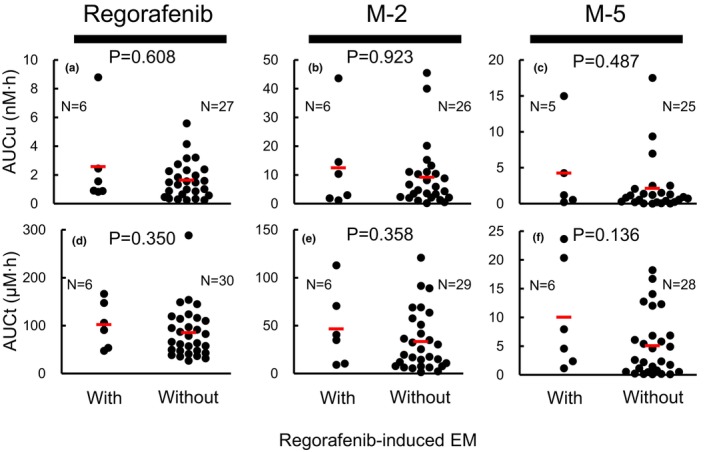
Associations of AUC u or AUC t values of regorafenib (a or d), M‐2 (b or e), and M‐5 (c or f) with regorafenib‐induced EM. No significant differences between AUC u or AUC t values of regorafenib, M‐2, and M‐5 with regorafenib‐induced EM were observed. AUC u and AUC t were analyzed for 36 patients, which included 6 patients with grade 3 EM. We failed to determine AUC u or AUC t values in some patients because of the plasma concentrations below the limit of quantitation. Wilcoxon test. Bars represent the means. AUC u , unbound plasma concentration base area under the plasma concentration‐time curve; AUC t , total plasma concentration base area under the plasma concentration‐time curve; EM, erythema multiforme.