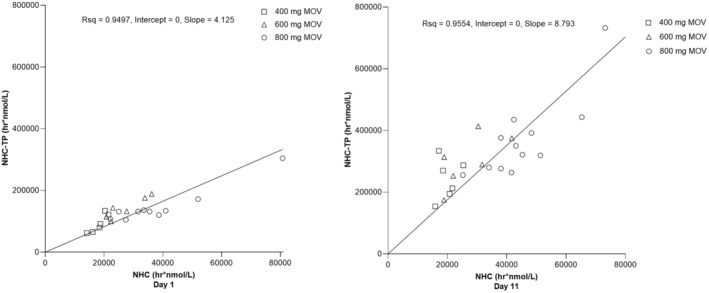
FIGURE 3.

Individual AUC0–12 of NHC in plasma versus NHC‐TP in PBMCs following administration of multiple oral doses of molnupiravir 400 mg, 600 mg, and 800 mg every 12 h for 10.5 days to healthy participants (n = 6 for 400 and 600 mg, n = 12 for 800 mg). Left panel: day 1; Right panel: day 11. AUC0‐12, area under the concentration‐time curve from time 0 to 12 h; MOV, molnupiravir; NHC, β‐D‐N4‐hydroxycytidine; NHC‐TP, β‐D‐N4‐hydroxycytidine‐triphosphate; PBMCs, peripheral blood mononuclear cells; Rsq, coefficient of determination.
