FIGURE 3.

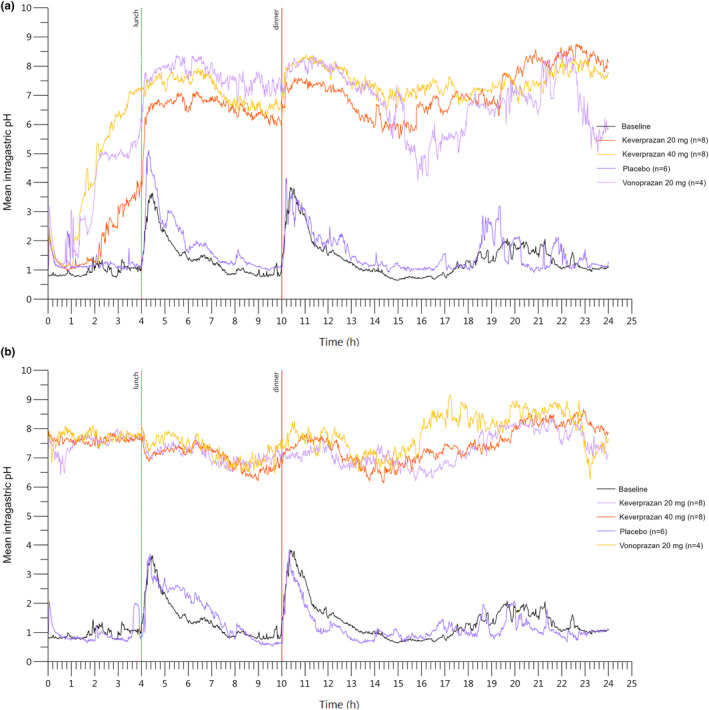
Mean intragastric pH‐time curves on day 1 (a) and day 7 (b) after the administration of 20 mg keverprazan, 40 mg keverprazan, 20 mg vonoprazan, or placebo.

Mean intragastric pH‐time curves on day 1 (a) and day 7 (b) after the administration of 20 mg keverprazan, 40 mg keverprazan, 20 mg vonoprazan, or placebo.