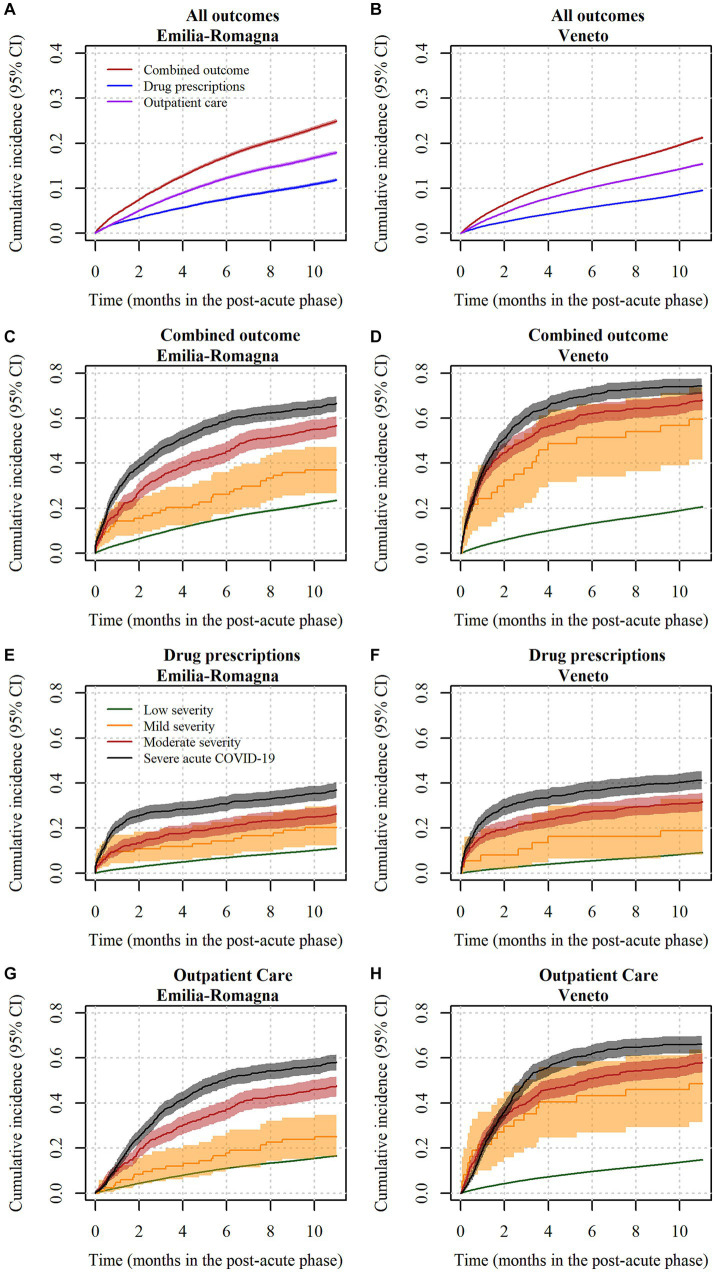
Figure 3.
Cumulative incidence curves of drug prescriptions and outpatient care in subjects at low risk of severe COVID-19 disease, by COVID-19 severity. Notes: (A) = incidence of outcomes in Emilia-Romagna; (B) = incidence of outcomes in Veneto; (C) = incidence of the combined outcome in Emilia-Romagna, by COVID-19 severity; (D) = incidence of the combined outcome in Veneto, by COVID-19 severity; (E) = incidence of selected drug prescriptions in Emilia-Romagna, by COVID-19 severity; (F) = incidence of selected drug prescriptions in Veneto, by COVID-19 severity; (G) = incidence of selected outpatient care in Emilia-Romagna, by COVID-19 severity; (H) = incidence of selected outpatient care in Veneto, by COVID-19 severity. In sub-figures (A) and (B), red lines indicate the composite outcome, blue lines indicate the drug prescription outcome, and purple lines indicate the outpatient care outcome. In sub-figures from (C–H), green lines indicate low severity subjects, yellow lines indicate mild severity subjects, red lines indicate moderate severity subjects and black lines indicate severe subjects. In all sub-figures, lines indicate punctual estimates of the cumulative incidence function and areas represent 95% confidence intervals. Confidence intervals were calculated with the asymptotic Aalen method. CI = confidence interval.

