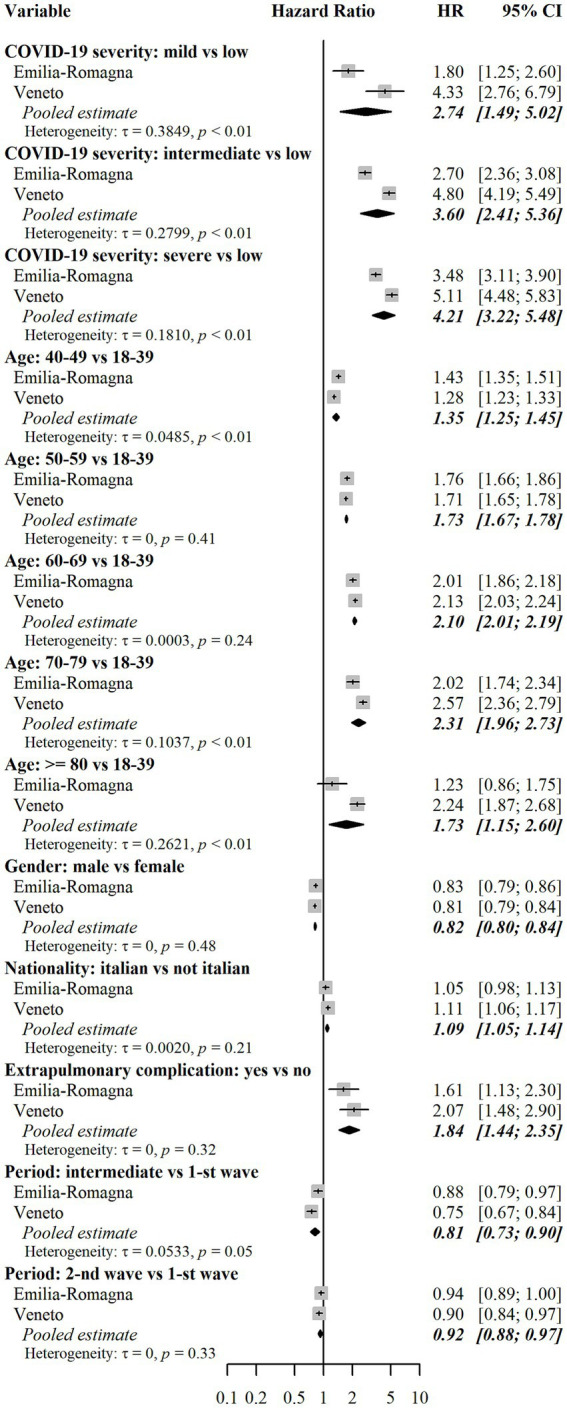
Figure 4.

Assessment of risk factors for the combined outcome. Notes: Results for each cohort were estimated using multivariable Fine-Gray subdistribution hazard models. Confidence intervals for hazard ratios in the two cohorts were calculated with the Wald method based on normal approximation and were two-sided. Pooled results were estimated using random effects meta-analysis with inverse variance weights and maximum likelihood estimator for between-study variance. The models also included the following independent variables: risk of hospitalization and death score (only in the E-R cohort), and Local Health Units (8 in E-R and 9 in Veneto). Additional results for these variables are reported in Supplementary Table 4. The combined outcome includes selected drug prescriptions and selected outpatient care, whichever came first. Heterogeneity was measured with the tau (τ) statistic and its significance was assessed with the Cochran’s Q test. HR = subdistribution hazard ratio. CI = confidence interval. p = p-value.
