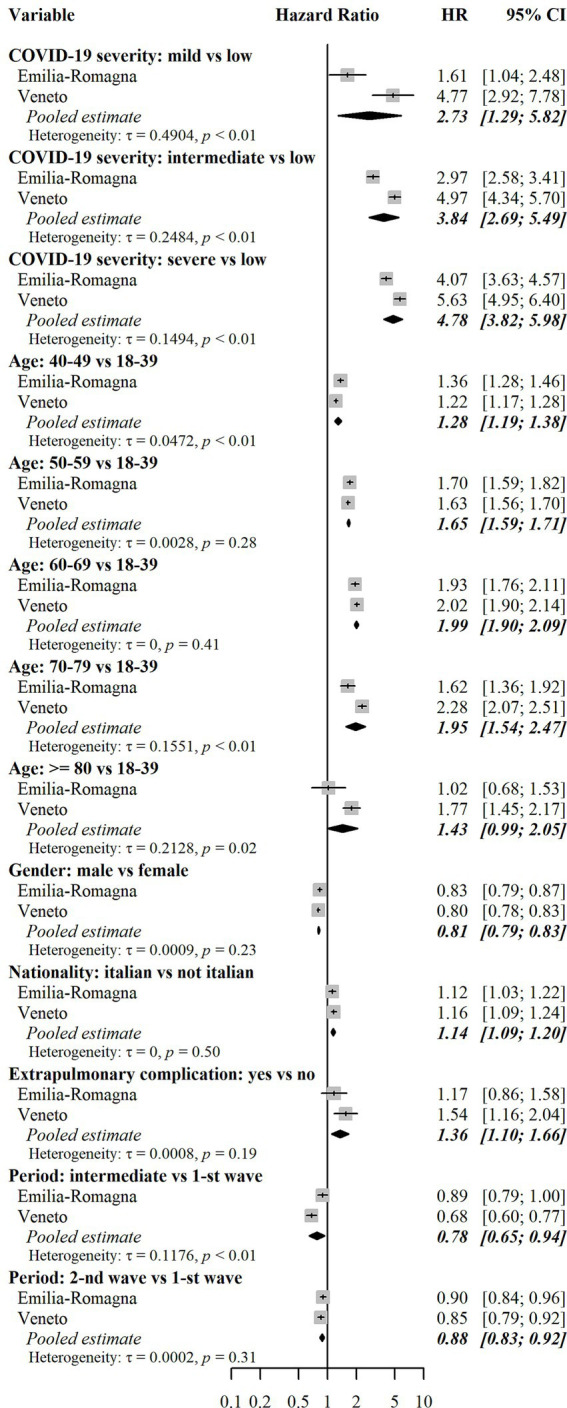
Figure 6.

Assessment of risk factors for outpatient care. Results for each cohort were estimated using multivariable Fine-Gray subdistribution hazard models. Confidence intervals for hazard ratios in the two cohorts were calculated with the Wald method based on normal approximation and were two-sided. Pooled results were estimated using random effects meta-analysis with inverse variance weights and maximum likelihood estimator for between-study variance. The models also included the following independent variables: risk of hospitalization and death score (only in the E-R cohort), and Local Health Units (8 in E-R and 9 in Veneto). Additional results for these variables are reported in Supplementary Table 4. Heterogeneity was measured with the tau (τ) statistic and its significance was assessed with the Cochran’s Q test. HR = subdistribution hazard ratio. CI = confidence interval. p = p-value.
