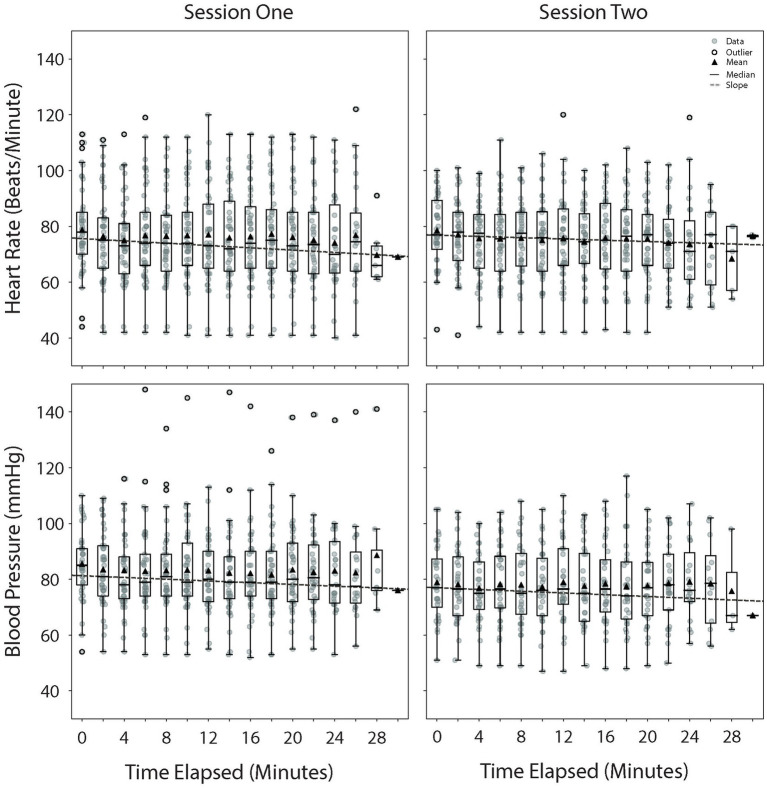
Figure 3.
Physiological change throughout the VR sessions. Heart rate (top) and blood pressure (bottom) throughout the VR sessions. Time 0 represents the start of the session. The average duration of the sessions was 24 ± 2.62 min. The mean of the data points per time period is represented by a triangle symbol. VR, virtual reality.

