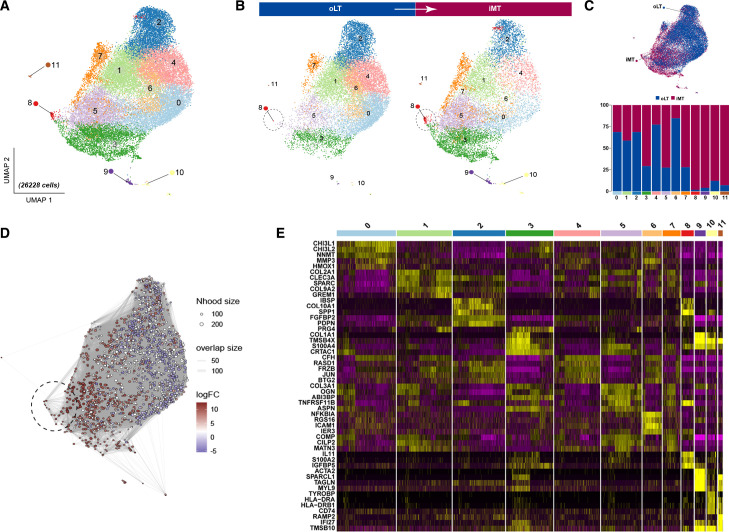
Figure 2.
Single-cell sequencing of human knee articular cartilage tissues from weight-bearing and non-weight-bearing regions. (A) The single-cell RNA sequencing (scRNAseq) of chondrocytes was visualised using Uniform Manifold Approximation and Projection (UMAP) plots, which demonstrated 12 distinct chondrocyte subsets. A total of n=3 patients with OA were included in the study, and chondrocytes from both weight-bearing (iMT) and non-weight-bearing (oLT) cartilage patient-matched sites were subjected to scRNAseq analysis. (B) Identification of a disparate population (black circle) in OA cartilage undergoing transitions from non-weight-bearing to weight-bearing states, visualised through UMAP plot split by weight-bearing conditions (oLT vs iMT). (C) UMAP plot illustrates the distribution of chondrocyte subsets under different weight-bearing conditions (upper panel). Percentage distribution of the 12 different subsets according to either weight-bearing (iMT) or non-weight-bearing (oLT) sites (lower panel). (D) Milo analysis reveals a significant upregulation in the abundance of cell neighbourhoods in the disparate subset (black circle) compared with other subpopulations. (E) Heatmap showing the z-score average gene signature expression of the top 5 most differentially expressed genes within each of the 12 chondrocytes clusters.

