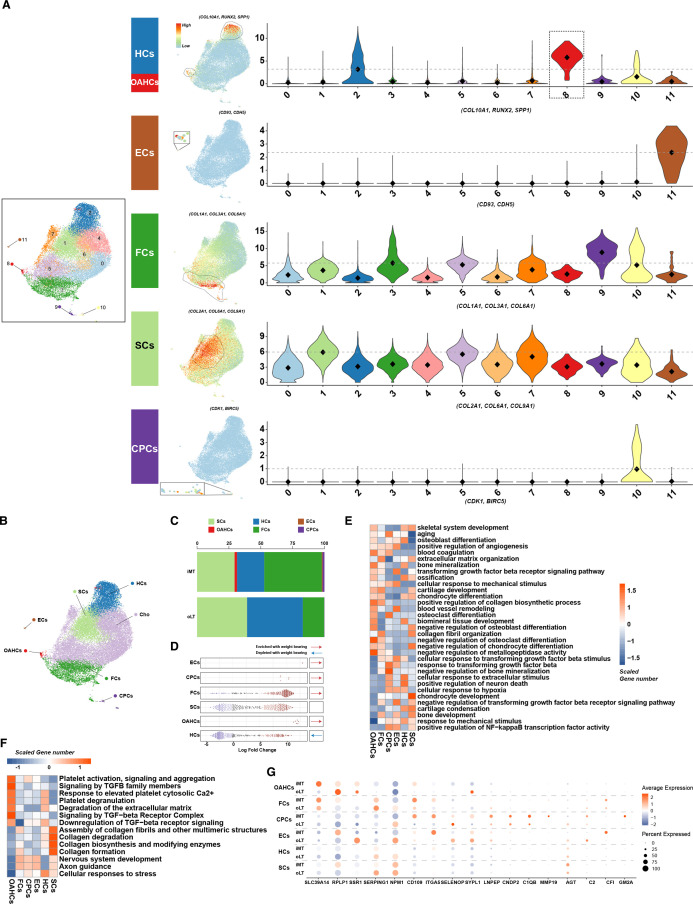
Figure 3.
Single-cell RNA sequencing identifies distinct chondrocyte subsets in the cartilage from weight-bearing (iMT) and non-weight-bearing (oLT) sites in patients with osteoarthritis (OA). (A) Visualisation of chondrocytes subsets by Uniform Manifold Approximation and Projection (UMAP) plot (left panel). Feature plots show the expression distribution of subset-specific markers for each of the seven chondrocyte subsets (clusters 1–3, 8–11) on the UMAP plot (middle panel). Violin plots showing the expression levels of these markers, the grey dashed line highlights a comparatively higher average expression level relative to other subsets (right panel). (B) Visualisation of the spatial distribution of annotated chondrocyte subsets on the UMAP plot. (C) The percentage distribution of stable chondrocytes, hypertrophic chondrocytes, endothelial cells, osteoarthritis hypertrophic chondrocytes (OAHCs), fibrochondrocytes, and chondrogenic progenitor cells in cartilage tissues under different weight-bearing conditions. (D) Milo analysis reveals a pronounced enriched associated with weight-bearing conditions in the abundance of cell neighbourhoods in the OAHCs compared with other chondrocytes. (E) Heatmap of biological process significantly associated with the transcriptome of each of the six annotated chondrocytes subsets as identified using DAVID functional annotation tool, and coloured by scaled gene number. (F) Heatmap of significant pathways for each of the six chondrocytes subsets as identified using Reactome Pathway Database, and coloured by scaled gene number. (G) DotPlot depicts the expression pattern of differentially expressed proteins identified through Tandem Mass Tag proteomics analysis in each of the annotated chondrocyte subsets. The size of the circles represents the proportion of protein expression in the corresponding subset, while the colour indicates the average expression level.

