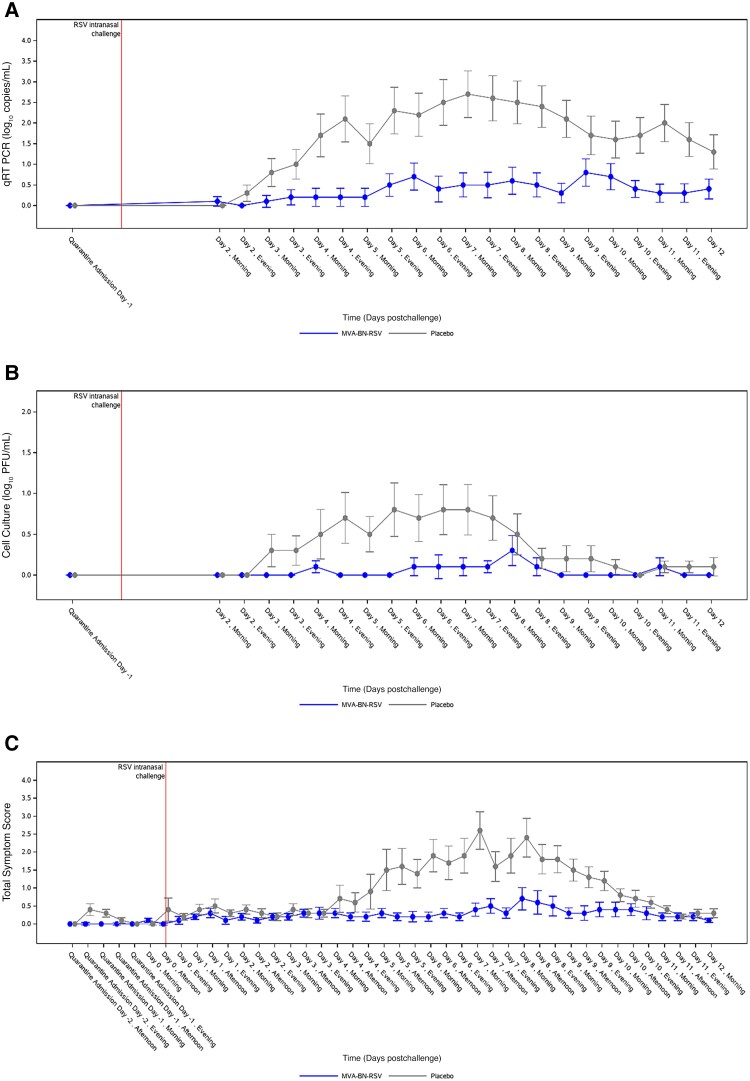
Figure 2.
Mean viral load and symptoms over time. A, Viral load by qRT-PCR from day 2 to day 12. B, Viral load by quantitative virus culture from day 2 to day 12. C, Symptom score from day −2 to day 12. X-axis values are slightly offset for better readability of the comparison between treatment groups. Analyses performed on the per protocol analysis set. Viral load results that were less than the lower limit of quantitation were arbitrarily set to 0. Error bars show standard error. Abbreviations: PFU, plaque-forming units; PP, per protocol; qRT-PCR, quantitative reverse transcription polymerase chain reaction; RSV, respiratory syncytial virus; TSS, total symptom score.

