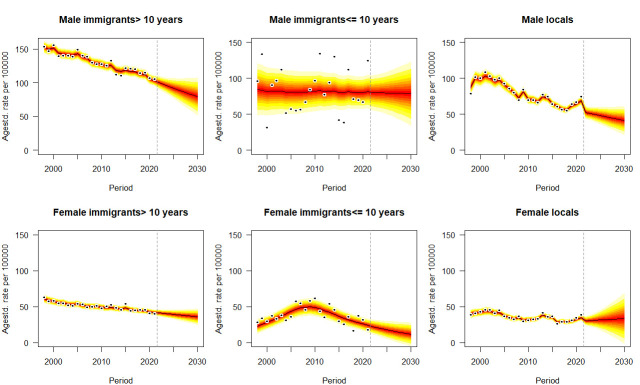
Figure 3.
Projections of lung cancer mortality rates by gender and immigrant status from 2022 to 2030. Observations are shown as dots with the predictive distribution between the 5% and 95% quantile, whereby each lighter shade of red represents an additional 10% predictive CI. The predictive mean is shown as black solid line and the vertical dashed line indicates where prediction started.

