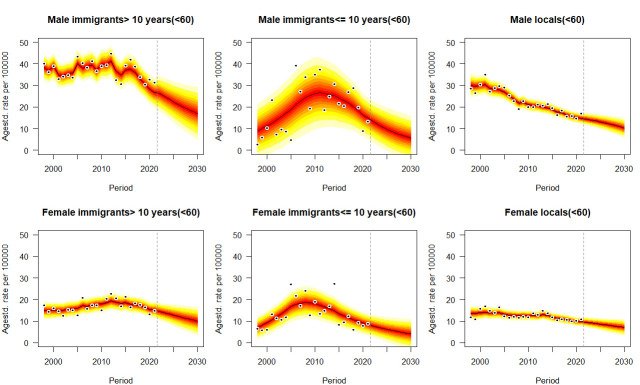
Figure 4.
Projections of lung cancer mortality rates for the population younger than 60 by gender and immigrant status from 2022 to 2030. Observations are shown as dots with the predictive distribution between the 5% and 95% quantile, whereby each lighter shade of red represents an additional 10% predictive CI. The predictive mean is shown as black solid line and the vertical dashed line indicates where prediction started.

