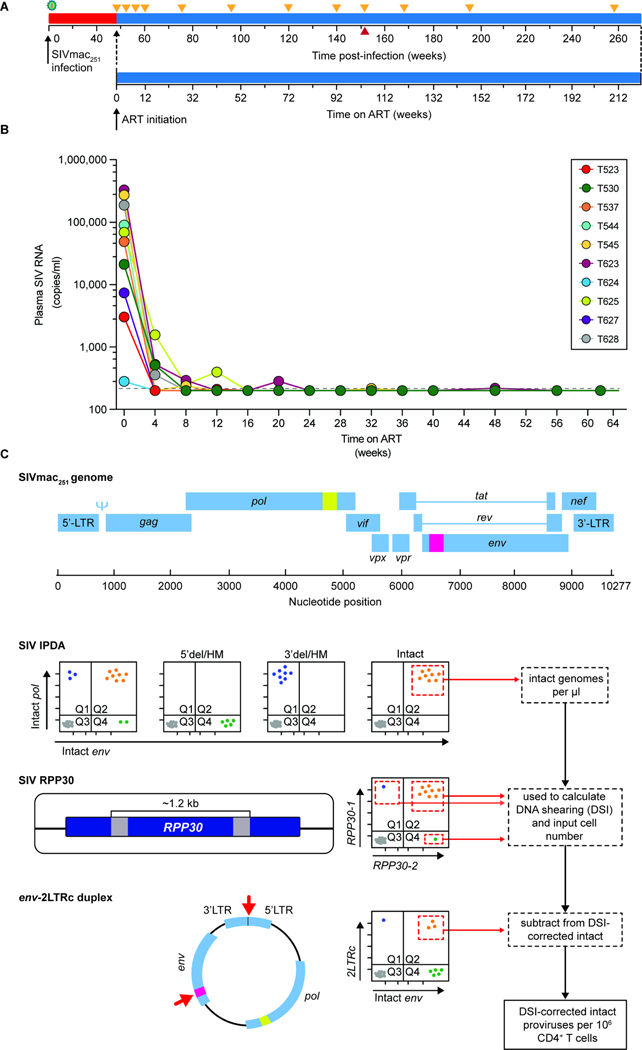
Figure 1. Study design.
(A) Timeline of infection, initiation of ART, and sampling. Animals were infected by repetitive intrarectal challenge with SIVmac251 and maintained untreated for 48 weeks after initial challenge (red) before initiation of ART (blue). Orange triangles indicate sampling times. The red triangle indicates the last time point before two animals (T545 and T628) were necropsied due to unrelated complications. (B) Plasma SIV RNA levels after ART initiation. The assay detection limit (200 copies/ml) is indicated by the dashed gray line. (C) Design of the SIV Intact Proviral DNA Assay (IPDA)20. Locations of two amplicons in the SIV genome are indicated in yellow (pol) and pink (env). Data from 3 individual assays are used to determine the frequency of intact proviruses per 106 CD4+ T cells. Events from quadrant 2 (Q2) of the IPDA measure the number of intact genomes. Proviruses with deletions or hypermutation affecting the pol amplicon (5’del/HM) appear in Q4 while proviruses with deletions or hypermutation affecting the env amplicon (3’del/HM) appear in Q1. Proviruses with defects affecting both amplicons appear in Q3 along with droplets lacking a provirus. The number of intact proviruses (Q2) is corrected for shearing using the DNA Shearing Index (DSI), and the input cell number is determined using ddPCR amplification of two similarly spaced amplicons in a cellular gene (RPP30) as described20,21. 2LTR circles are quantitated in a separate ddPCR assay using two amplicons, one spanning the LTR-LTR junction62 and one in env (red arrows)20. Events in Q2 of the env-2LTRc duplex assay are subtracted from the number of intact proviruses to correct for 2LTR circles.

