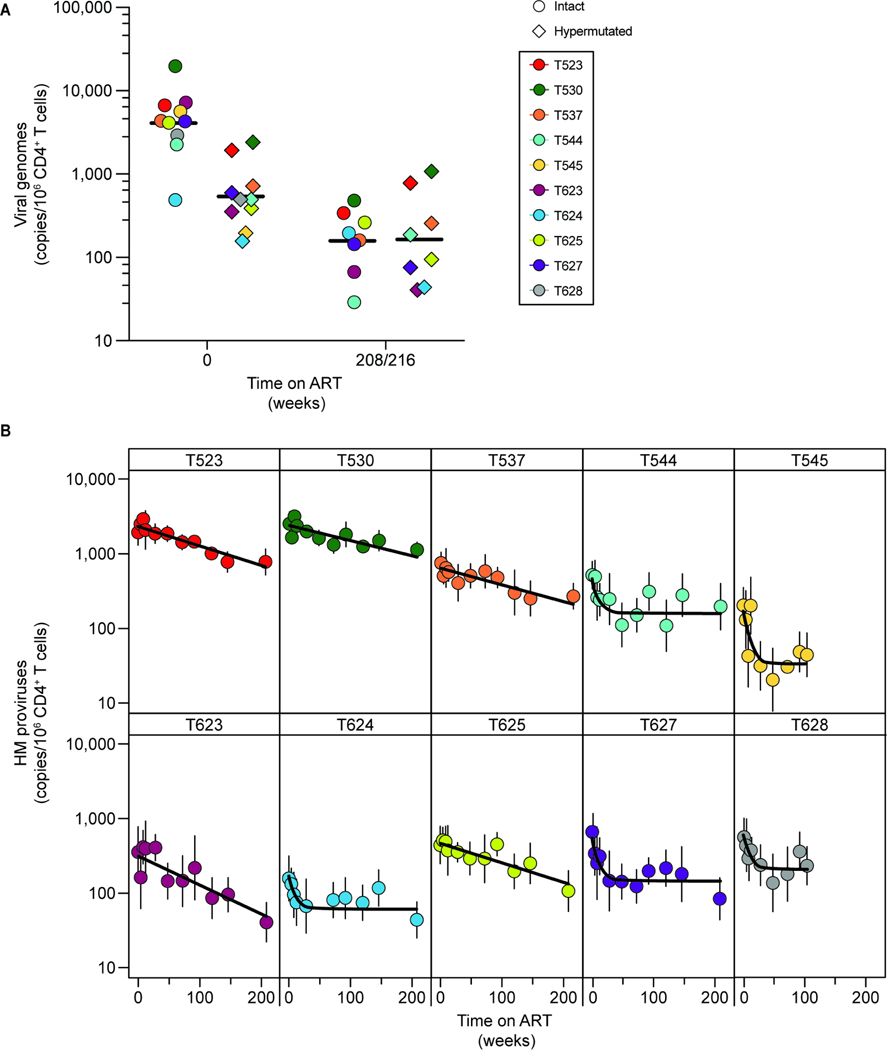
Figure 3. Decay of hypermutated proviruses after ART initiation.
(A) Comparison of the frequency of intact and hypermutated proviruses prior to ART initiation (t=0) and at the latest time point analyzed (week 208 for all animals except T537, in which case it is week 216). Each datapoint represents the geometric mean for the IPDA or HPDA. A total of 3 replicates for each animal are included for the IPDA, and 6 replicates for the HPDA. IPDA data are corrected for env+2LTR circles and shearing. HPDA data are corrected for shearing. Black lines show the geometric means. (B) Decay of hypermutated proviruses on ART. Data were fitted to biphasic or monophasic decay models (black line) as described in the Methods section. Vertical lines represent the standard deviations.

