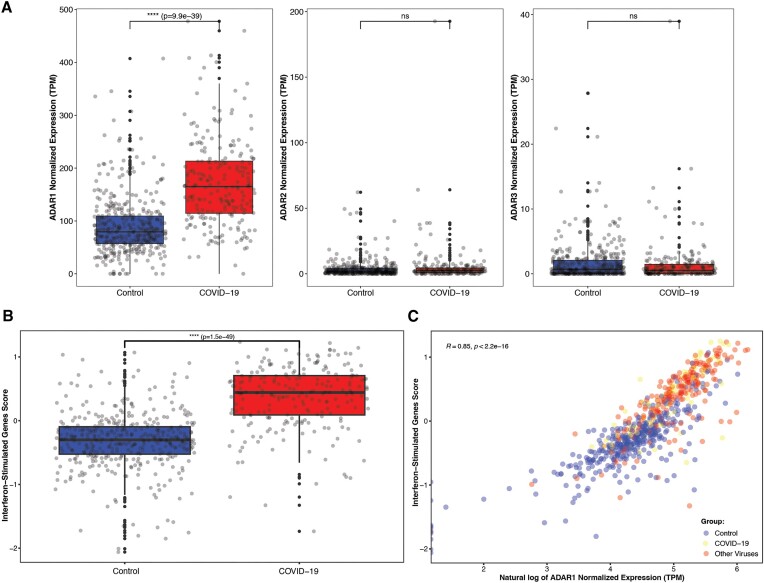
Figure 3.
ADAR enzymes and other interferon-stimulating genes expression levels and correlations. (A) Expression levels of ADAR1, ADAR2 and ADAR3 in the COVID-19 group compared to controls. (B) Calculated interferon-stimulated genes (ISG38) score, as derived from a 38-genes signature, in the COVID-19 group compared to controls. The result is significantly higher in the COVID-19 group. (C) Correlation between ADAR1 expression levels and ISG38 score, for the COVID-19 group (red dots), the other respiratory-viruses group (yellow dots) and the controls (blue dots).

