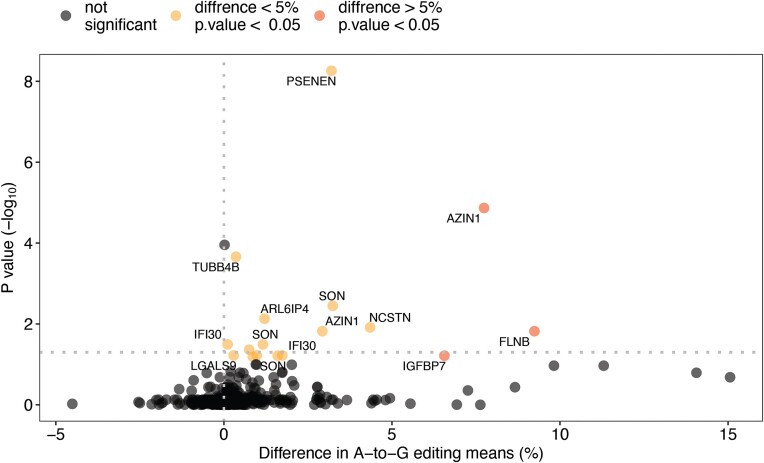
Figure 6.
Editing differences between the COVID-19 group and the controls in 1517 coding sites that are prone to RNA editing. For each of the sites, the mean percentage of A-to-I editing was calculated in the COVID-19 group and in the controls. The difference in means between the two groups is depicted on the x axis (positive values indicate higher editing percentage in the COVID-19 group whereas negative values indicate higher editing percentage in the controls); sites of meaningful difference (defined as difference higher than 5%) are colored in red. The significance of the results is depicted on the y axis; sites of high significance (Wilcoxson P-value below 0.05) are colored in yellow or red. The 17 sites that exhibit statistically significant false discovery rate (FDR), and their corresponding gene symbols are labeled.

