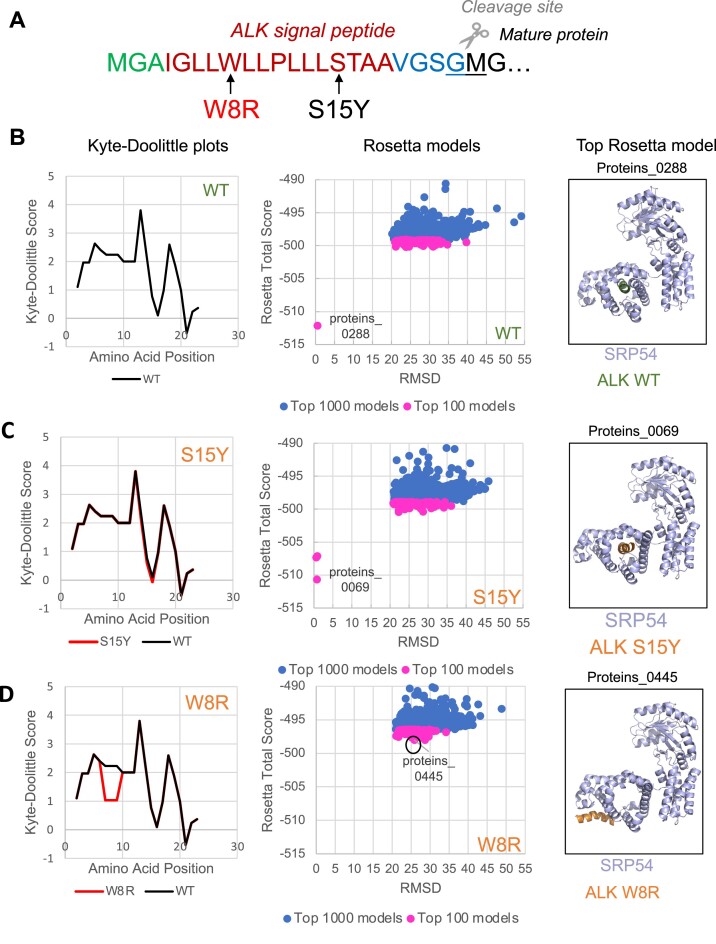
Figure 6.
in silico molecular modeling of SRP54 interactions with signal peptides. (A) Positions of mutations W8R (PPV, marked in red) and S15Y (NPV, marked in black) in the signal peptide of ALK receptor tyrosine kinase. Signal peptide was predicted by SignalP6.0. (B–D) Modeling of the wild-type ALK signal peptide (B) and the mutants, S15Y (C), W8R (D). The hydrophobicity of each signal peptide was determined using the Kyte-Doolittle scale and shown in the left panels. Signal peptide mutants (red line) are compared to the WT ALK signal peptide (black line) to determine the predicted change in hydrophobicity. The top 100 (pink) and top 1000 (blue) models of the corresponding signal peptides and SRP are created using ROSIE (Rosetta Online Serve that Includes Everyone) and their distribution is shown in the central panels. The top models, which are most minimized, are labeled. These top models were selected and visualized by the use of PyMol and shown in the right panels. Wild-type signal peptide (WT) is shown in green, mutated signal peptides are in orange, and M-domain of SRP54, a subunit of SRP, is shown in light blue.

