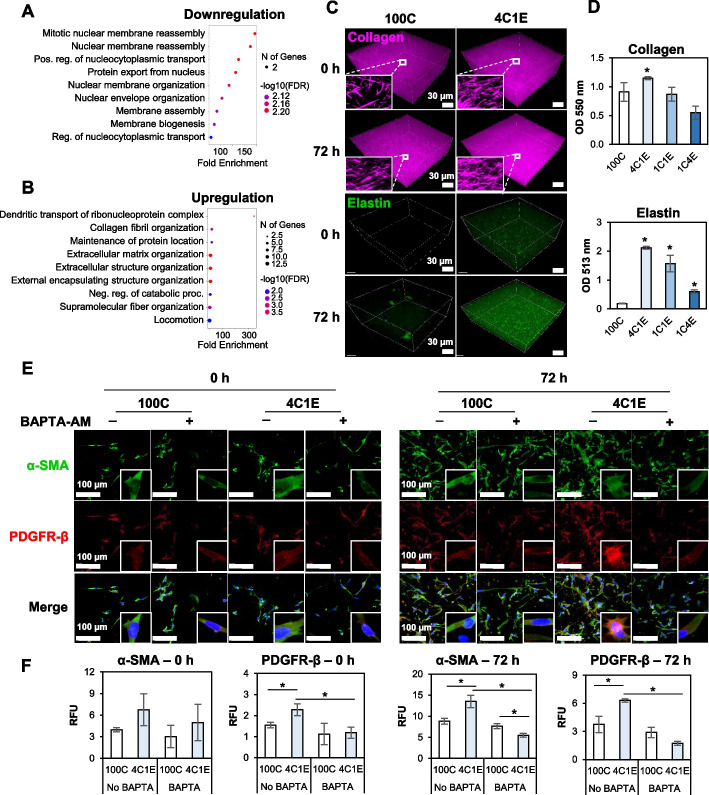
Fig. 5.
Late stage of proteomic changes. Bubble plots represent the biological processes of A downregulated and B upregulated proteins in 4C1E compared with 100C. The vertical axis shows the significantly enriched biological processes, and the horizontal axis represents the fold enrichment corresponding to the biological processes. Fold enrichment indicates the percentage of differentially expressed proteins divided by all proteins within a certain GO term. C MNLO imaging of hydrogels with cells at 0 h and 72 h. The purple SHG signal represents collagen, and the green TPEF signal represents elastin and autofluorescent molecules in cells. D Colorimetric measurement of generated collagen and elastin in hydrogels after 72 h. E Expression of α-SMA (green) and PDFGR-β (red) proteins in hydrogels with or without BAPTA-AM (100 µM) treatment at 0 h and 72 h. DAPI (blue) indicates the nuclei. F Analysis data derived from the images in E. Data are represented as mean ± SD of triplicate analyses. * p < 0.05

