Fig. 3.
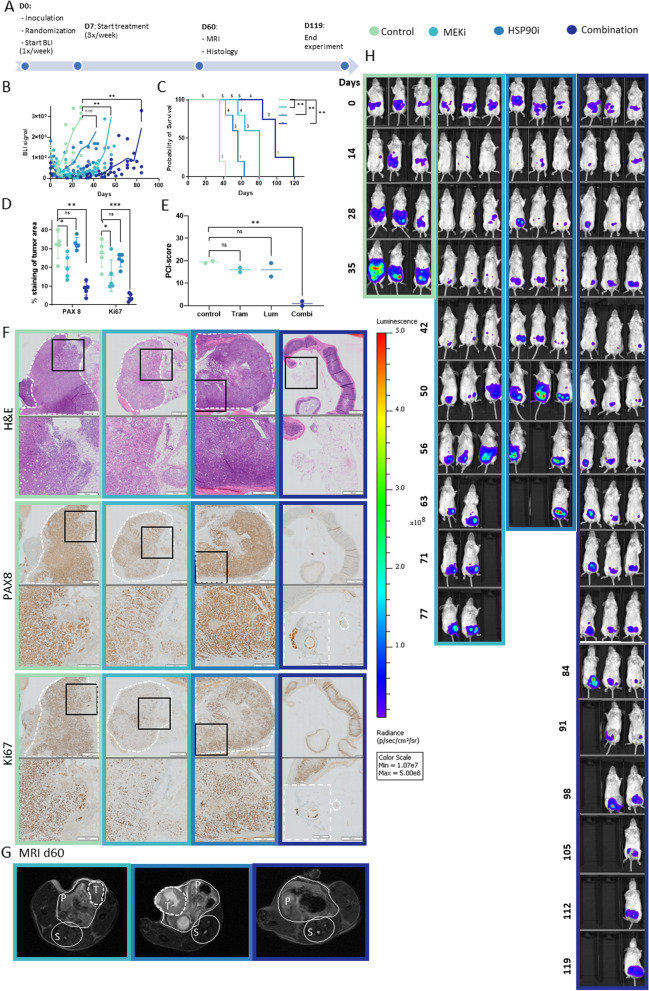
MEKi/HSP90i treatment of LGSOC intraperitoneal LGSOC mouse model. Treatment groups are indicated by color code for the entire figure. A Timeline of the mice experiment. At day 0 (D0) mice are inoculated with PM-LGSOC-01 Luc eGFP and randomized according to their BLI signal. At day 7 (D7) MEKi/HSP90i treatment is started and continued 3 times a week till humane endpoint is reached and mice are euthanized. At day 60 (D60) MRI is performed on one mouse per group, except for the control group, as all control mice reached the endpoint before day 60. At the same timepoint two mice per group are euthanized for intermediate histology analysis; for the control group, mice at the endpoint are used. B Weekly BLI results of individual mice are indicated in a graph with colored dots representing individual mice, and a continuous colored line indicating the average BLI. C Kaplan–Meier survival curve based on the humane endpoint. Numbers in the curve indicate the number of animals at risk. D Quantification of immune histology staining’s performed on five tumor regions of the intermediate euthanized mice. E Peritoneal carcinomatosis index (PCI)-score of the intermediate euthanized mice. F (Immuno)histology of intermediate euthanized mice. In each panel, the bottom image is a larger magnification of an area indicated by a black square in the upper panel. In the combination treatment, an inset in the larger magnification indicates an additional enlargement of a tumor area indicated by a white dotted line. Scale bars are respectively 1 mm, 500 µm and 100 µm. G MRI scans at day 60, dotted line indicates the tumor (T). In the combination treatment no tumor could be detected at day 60. The spinal cord (S) and peritoneal cavity (P) are indicated. H BLI images of 3 individual and representative mice monitored up to 119 days. *p < 0.05, **p < 0.01 and ***p < 0.001

