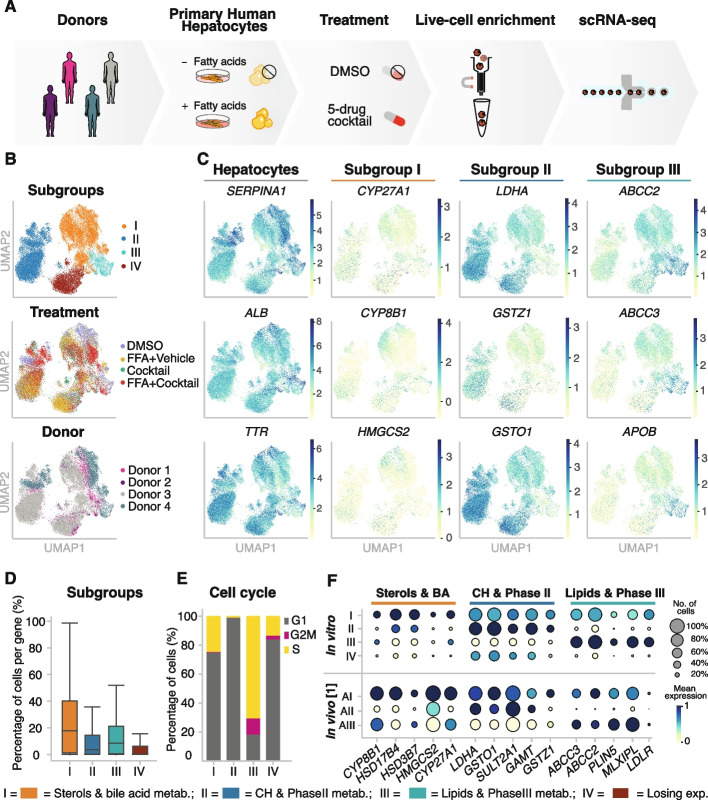
Fig. 1.
Transcriptomic profiling reveals four subgroups of PHHs independently of donor and treatment condition. A Overview of experimental design. Purified cryopreserved PHHs from four human donors were plated, incubated with or without free fatty acids to model hepatic fat accumulation and with or without a phenotypic 5-drug cocktail (Sanofi-Aventis). B UMAP colored by subgroup, treatment, and donor showing that the annotated subgroups are found throughout all donors and conditions. C UMAP colored by expression levels of—from left to right: (i) key hepatocyte marker genes, (ii) bile acid and sterol metabolism; (iii) carbohydrate and phase II metabolism, (iv) lipid and phase III metabolism marker genes in four subgroups of hepatocytes. D Boxplot showing the percentage of cells in which a given gene is expressed, colored by the identified subgroups. E Bar plot showing the percentage of cells per subgroup assigned to phases G1, S, and G2M by performing cell cycle analysis using cyclone. F Dot plot highlighting marker gene expression in four subgroups of hepatocytes identified in vitro (top) and in vivo [1]. Subgroup marker gene expression was grouped by aggregated Louvain clusters (dot size: fraction of cells in the group; color scale: mean expression in the group)

