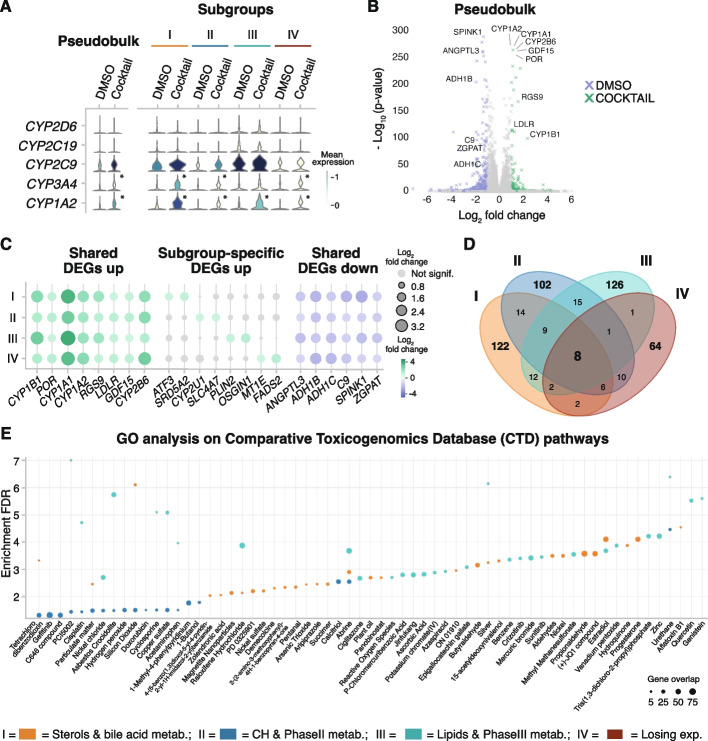
Fig. 2.
Subgroups of PHHs show different metabolic profile in response to 5-drug cocktail. A Violin plots depicting expression levels between Cocktail and DMSO of the five CYPs involved in the metabolism of the five-drug cocktail in pseudobulk (left), and in each hepatocyte subgroup (right) (* = p-value < 0.05 and |log2-fold change|> 1, t-test). B Volcano plot depicting the differential expression between Cocktail (green) and DMSO (purple) in pseudobulk. Text highlights the genes identified as DEGs in all subgroups. C Dot plot showing log2-fold change (color scale) and p-value (dot size) between Cocktail and DMSO for genes significantly up-regulated in all subgroups (left); representative subgroup-specific up-regulated genes (middle); and genes significantly down-regulated in all subgroups (right). D Venn diagram showing overlaps of significantly up-regulated genes upon cocktail treatment between the subgroups. E Scatter plot depicting enrichment of the genes specifically up-regulated in the metabolically active hepatocyte subgroups I, II, and III in pathways known to be involved in the metabolism of given chemical compounds (Drug.CTD database). The size of the dot corresponds to the number of overlapping genes in a given pathway

