Fig. 4.
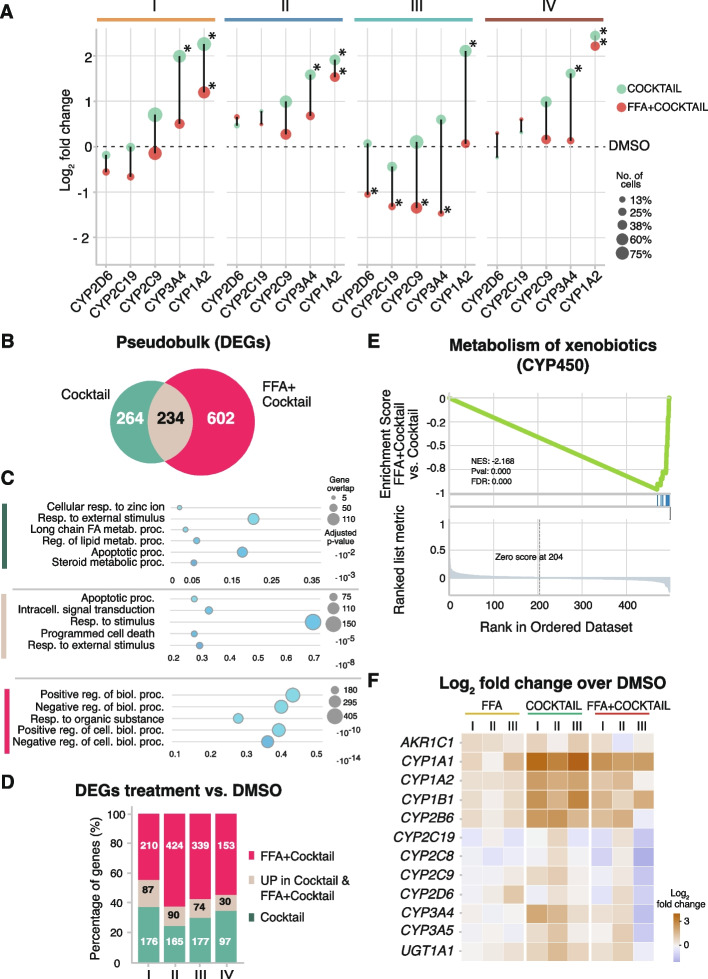
Intracellular lipid accumulation impairs drug metabolism phases I, II, and III. A Scatter plot depicting the log2-fold change of the 5 induced cytochromes between cocktail and DMSO (green), and between FFA + Cocktail and DMSO (red) in each subgroup (* = p-value < 0.05 and |log2-fold change|> 1, t-test). Dot size corresponds to the number of cells in which the gene is expressed. B Venn diagram showing the overlap of DEGs between Cocktail- vs. DMSO-treated cells (green) and FFA + Cocktail vs. DMSO-treated cells (red). C Scatter plot of the gene ontology (GO) analyses using gprofiler of the genes up-regulated specifically upon cocktail treatment (green); up-regulated specifically upon FFA + Cocktail treatment (magenta), and in both Cocktail and FFA + Cocktail (beige). The top 5 most significantly enriched terms are depicted. D Bar plot showing for each subgroup the percentages of genes specific to (a) Cocktail vs. DMSO (green); (b) genes up-regulated in both, Cocktail vs. DMSO and FFA + Cocktail vs. DMSO (beige); (c) specific to FFA + Cocktail vs. DMSO (magenta). E GSEA plot for FFA + Cocktail vs. Cocktail on the pathway of “Metabolism of xenobiotics by CYP450,” enriched in the Cocktail vs. DMSO-specific genes. F Heatmap depicting log2-fold change to DMSO level of genes involved in drug-metabolism related pathways that were enriched in Cocktail vs. FFA + Cocktail treatment

