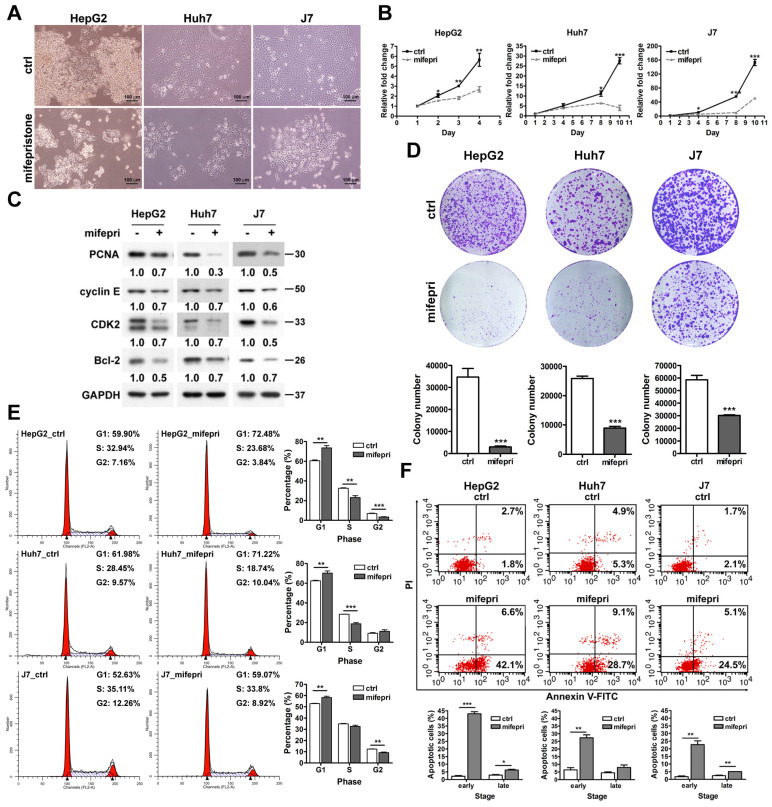
Figure 1.
Effect of mifepristone on the growth of HCC cells. (A) Cell morphology of HCC cell lines (HepG2, Huh7, and J7) in the absence (ctrl) or presence of mifepristone (20 μg/mL) for 48 h. (B) MTT cell proliferation assay performed with or without mifepristone (mifepri, 10 μg/mL). (C) Immunoblot assay: HCC cells were treated with or without mifepristone (mifepri, 10 μg/mL) for 24 h. (D) Colony formation assay for HCC cells after mifepristone (mifepri) treatment. Top panel: representative image; Bottom panel: quantitative assessment of the number of colonies. (E-F) Cell cycle (E) and cell apoptosis (F) were analyzed using flow cytometry. The histogram displays the percentage of cells in each cell cycle phase (E) and the percentage of apoptotic cells in the early and late stages (F). Detailed conditions and procedures for mifepristone treatment are described in the Materials and Methods section. The data represent the mean ± SD from three independent experiments and were analyzed using Student's t-test. Statistical significance is indicated as *P < 0.05; **P < 0.01; ***P < 0.001 compared to the control (ctrl).

