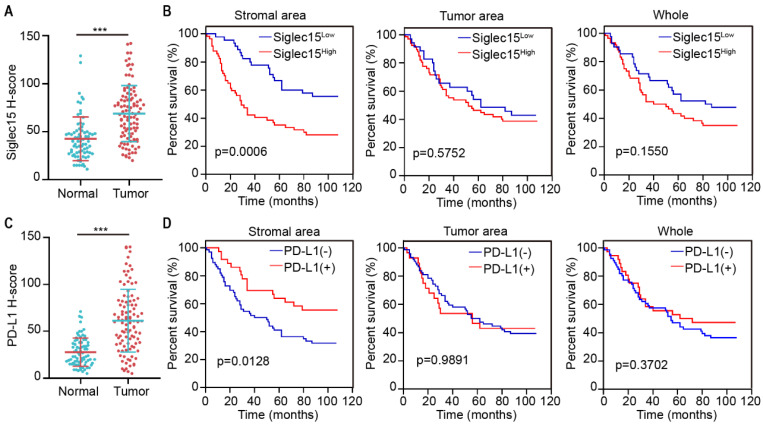
Figure 2.
Prognostic significance of Siglec15 and PD-L1 expression on prognosis in COAD. (A) H-score of Siglec15 in the primary human COAD tissue microarray and adjacent normal tissues. Data are means ± SEM. p-values are according to Student's t-test. (B) Overall survival curves were generated based on the protein levels of Siglec15 in stromal area, tumor area and whole cells of COAD. (C) H-score of PD-L1 in the primary human COAD tissue microarray and adjacent normal tissues. Data are means ± SEM. p-values are according to Student's t-test. (D) Overall survival curves were generated based on the protein levels of PD-L1 in stromal area, tumor area and whole cells of COAD. p-values are according to Kaplan-Meier plots and are compared to the log-rank test.


