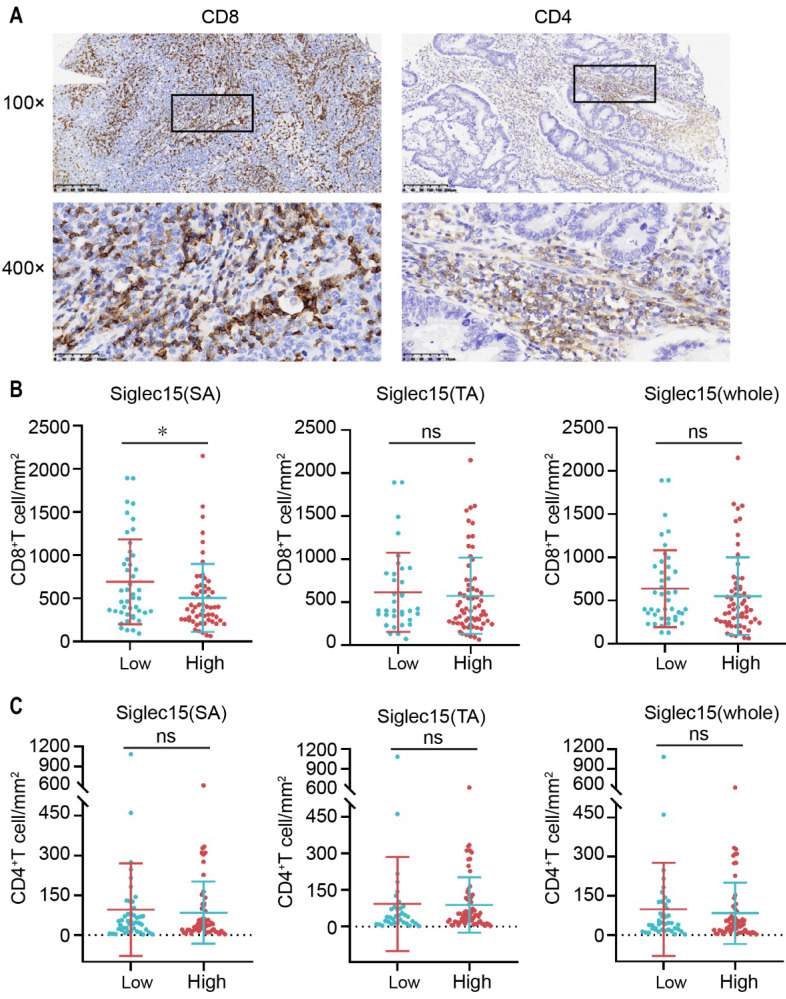
Figure 3.
Relationship between Siglec15 expression and the infiltration of CD4+/CD8+ TILs. (A) Representative micrographs of CD8 (left) and CD4 (right) expression in the COAD. Representative images are presented in 100× (upper) and 400× (below). (B and C) The correlation of Siglec15 expression and CD8+ T cells (B) and CD4+ T cells (C) in the COAD. Data are means ± SEM. p-values are according to Student's t-test.

