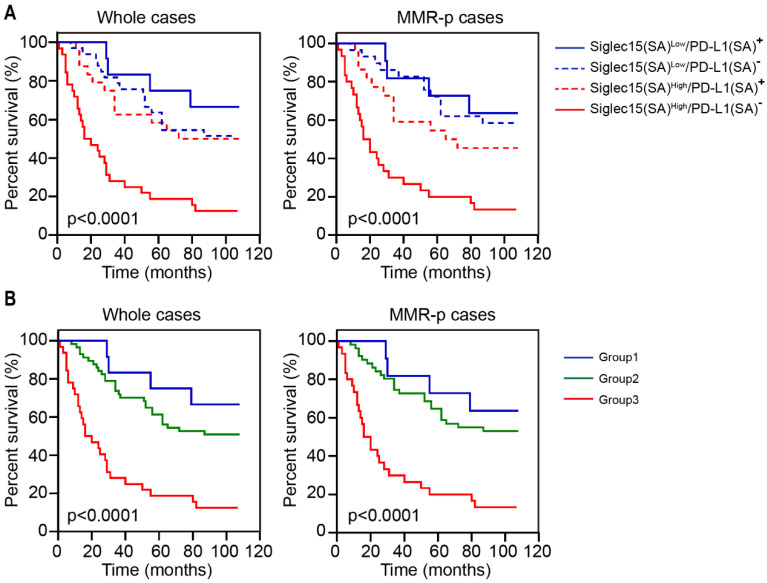
Figure 6.
Survival analysis for patients with COAD based on Siglec15 and PD-L1 expression in stromal area. (A) Kaplan-Meier survival curves for overall survival based on the expression status of Siglec15(SA)/PD-L1(SA) in COAD and MMR-p COAD. (B) Kaplan-Meier survival curves for OS in three groups: group 1, Siglec15(SA)Low /PD-L1(SA)+; group 2, Siglec15(SA)Low/PD-L1(SA)- or Siglec15(SA)High/PD-L1(SA)+ and group 3, Siglec15(SA)High/PD-L1(SA)-. p-values using Kaplan-Meier plots and compared with the log-rank test.

