
Extended Data Fig. 3 |. Additional analyses of crRNA library and CRISPRi data.
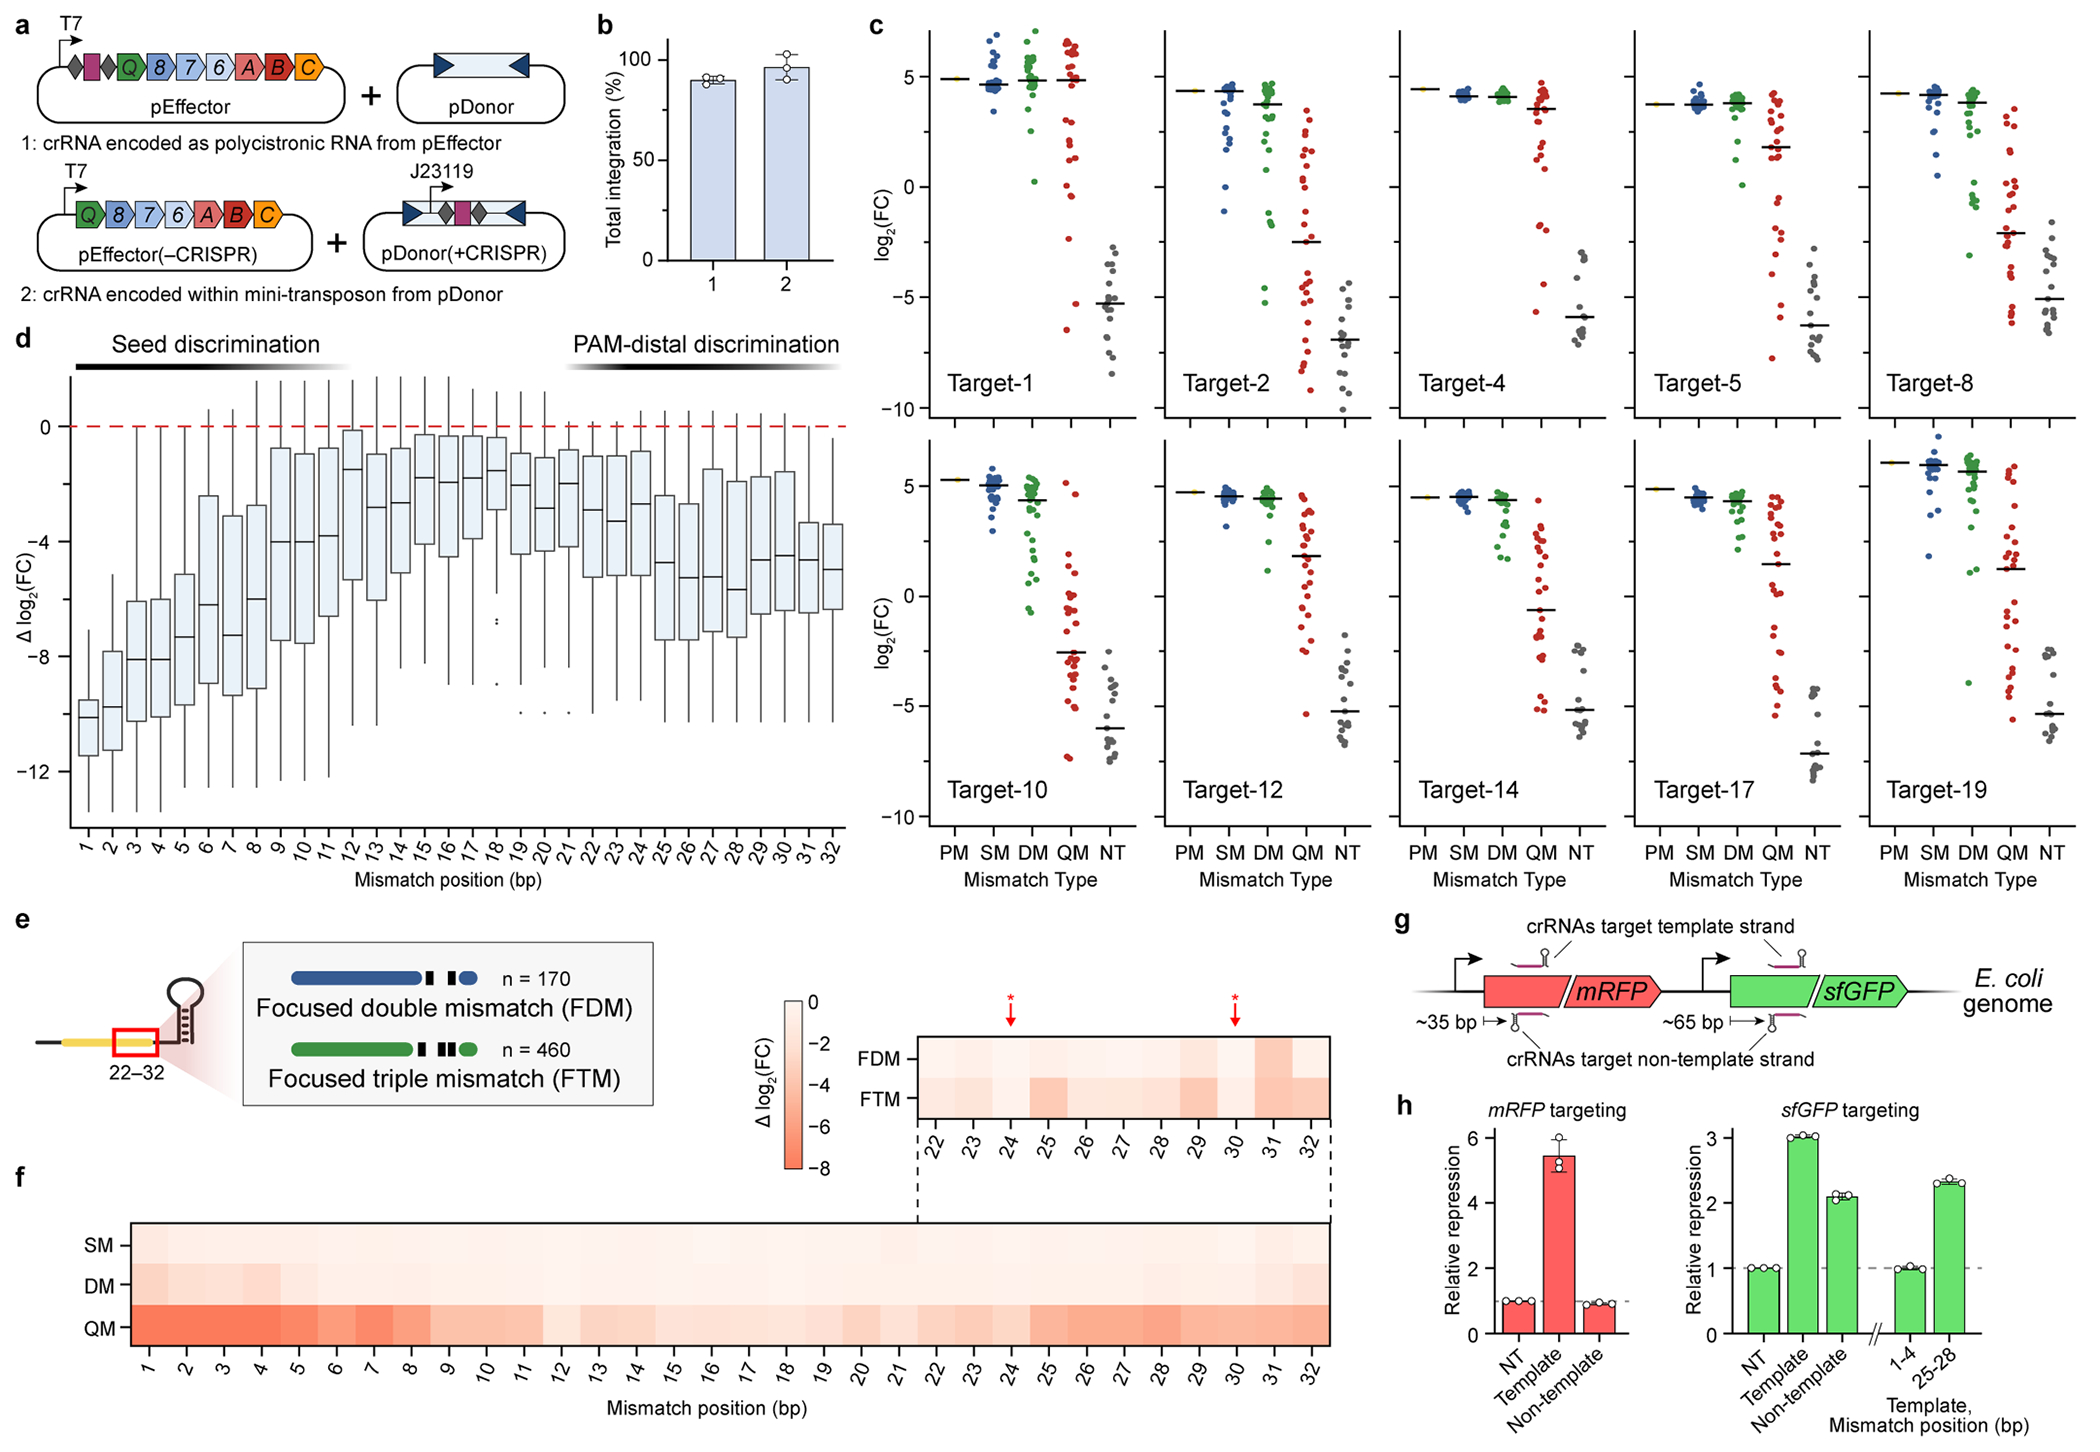
a, Two-plasmid system used for in vivo transposition assays with crRNA libraries. We relocated the CRISPR array from pEffector to inside the mini-transposon within pDonor itself (bottom), relative to pEffector and pDonor plasmids we described previously17 (top), thereby generating pEffector(−CRISPR) and pDonor(+CRISPR). b, RNA-guided transposition assays for the two sets of plasmid constructs shown in a, as measured by qPCR. Transposon-encoded crRNAs direct indistinguishable integration efficiencies. c, Enrichment scores for crRNA library members associated with their corresponding target sites, plotted as in Fig. 3d. d, Position-specific enrichment scores are plotted as the change in log2(fold change) relative to the perfectly matching crRNA, for crRNAs containing quadruple mismatches across all 10 target sites. Data are shown as box plots with single-bp resolution along the crRNA; boxes show the median and interquartile range, whiskers indicate the range or extend 1.5× the interquartile range from the 25th and 75th percentile in the presence of outliers (dots). The data reveal off-target discrimination in both the PAM-proximal seed sequence and a PAM-distal region (indicated at the top). e, Schematic of mismatched crRNA library members focused on positions 22–32 in the PAM-distal region. Members were designed to test the effects of non-adjacent mismatches on transposition. f, Position-specific enrichment scores were averaged across all 10 target sites and plotted for each mismatch type (SM, DM, QM) as the change in log2(fold change), similarly to Fig. 3e. Data from focused mismatches within positions 22–32 (schematised in e) are shown at the top, revealing a lack of discrimination at positions 24 and 30 (red arrows), where crRNA nucleotides are flipped out. g, Schematic showing the location of crRNAs targeting genomically encoded mRFP and sfGFP genes. Guides were designed to target both the template and non-template strands, and were positioned ~35 bp and ~65 bp downstream of the gene start codon, respectively. h, Transcriptional repression was measured for each of the targeting crRNAs alongside a non-targeting (NT) control; the crRNA targeting the template strand shows strongest repression. Mismatches at positions 1–4 and 25–28 for an sfGFP-targeting crRNA show similar effects as with the mRFP data shown in Fig. 3g. Data in b and h are shown as mean ± s.d. of n = 3 independent biological replicates. The absolute sample numbers shown in d are n = 10, 20, 30, 40, 30, 20, and 10 for mismatch position 1, 2, 3, 4–29, 30, 31, and 32, respectively.