
Figure 14.
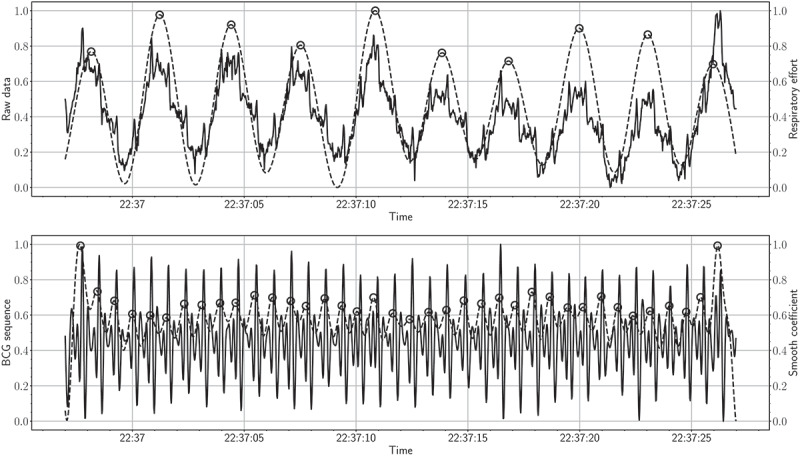
The top figure shows a 30-second raw signal along with the respiratory effort signal (solid and dashed lines present raw and respiratory data, respectively). The bottom figure shows a 30-second BCG signal along with the 4th level smooth coefficient (solid and dashed lines present BCG signal and smooth coefficient, respectively).