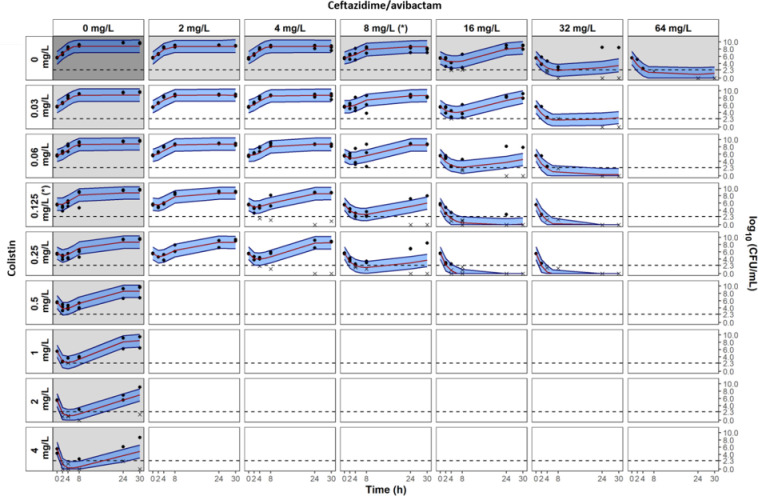
Fig 3.
Visual predictive checks of the observed interaction model of time-kill experiments for K. pneumoniae NARA1295. Grey and white panels are associated to single drug and combination experiments, respectively. Measured CFU are represented by dots. For graphical representation, data below limit of quantification are represented by cross at their measured values. Median percentile from simulations with the observed interaction model is represented by red line and the 80% prediction interval between 10th and 90th percentiles is represented by the blue shaded areas. Limit of quantification is represented by the dashed line at 2.3 log10CFU/mL. MICs of CZA and CST are indicated by (*). Avibactam concentration was fixed at 4 mg/L.

