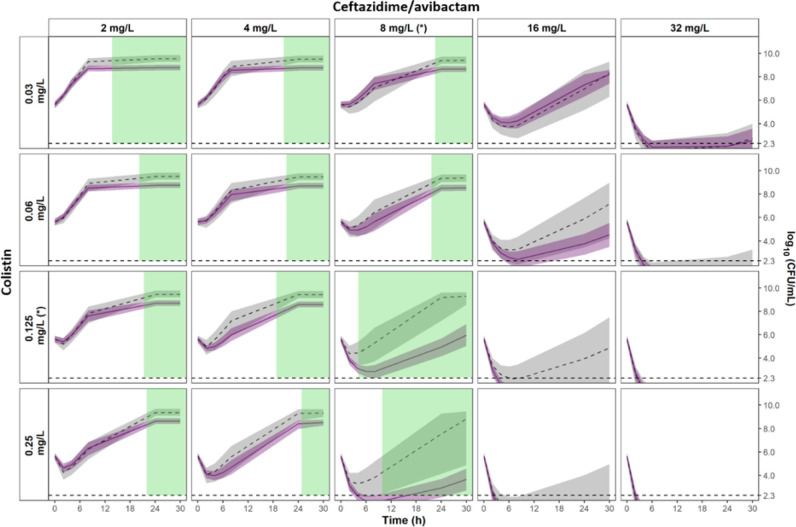
Fig 4.
Comparison of the 95%CIs of the observed interaction vs the expected additivity for K. pneumoniae NARA1295. The 95%CI of the expected additivity, obtained by parametric bootstrap, is represented by grey areas (n = 980 runs) and the corresponding median percentile is represented by the dashed line. The 95%CI of the observed interaction is represented by light purple areas and the median percentile is represented by the solid line (n = 976 runs). Statistically significant areas of synergy (nonoverlapping 95%CI) are highlighted in green. The limit of quantification is represented by the horizontal dashed line at 2.3 log10CFU/mL. MICs of CZA and CST are indicated by (*).

