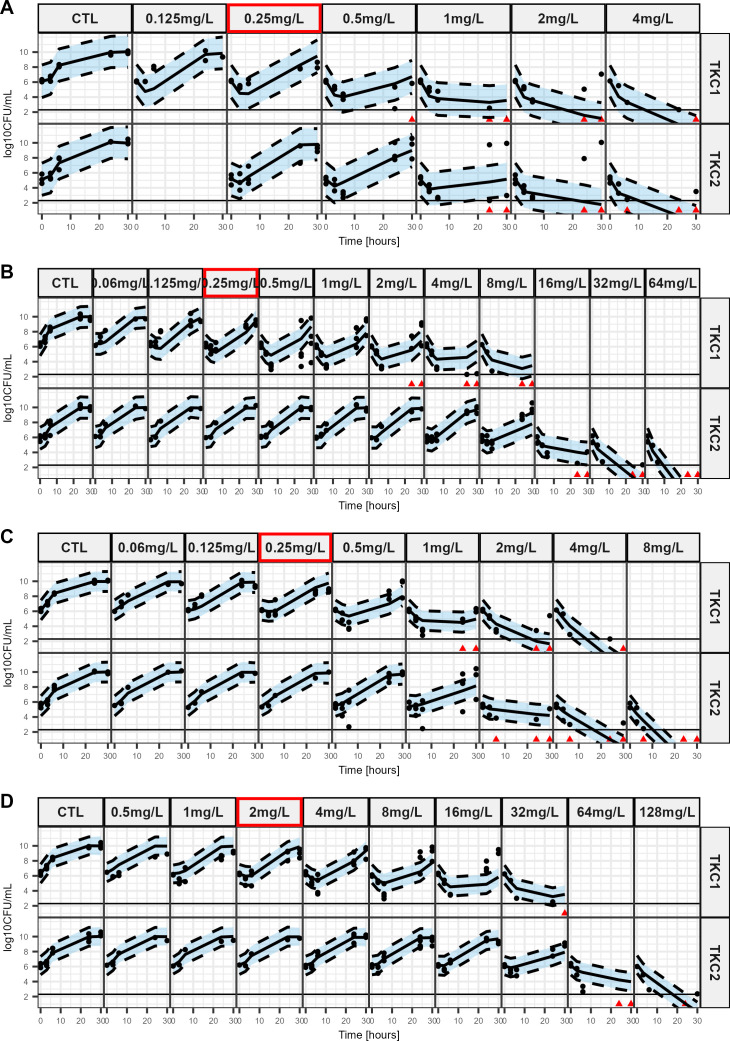
Fig 1.
Visual predictive checks of the final model based on in vitro sequential time kill data of ceftolozane/tazobactam for PAO1 and mutant-derived strains. The plots show the observed time-kill data at different C/T concentrations with model predictions as medians and 80% confidence intervals around the median (shaded area). The red frame represents the MIC value of the corresponding strain. Dots represent countable plates; red triangles represent data below the limit of quantification (BLQ: 2.3 log10 CFU/mL). Data below the limit of detection are plotted as 0.1 CFU/mL. (A). PAO1 (B). PAO1-AmpCG183D, (C). PAO1- AmpDH157Y, (D). PAO1-AmpCG183D/AmpDH157Y.

