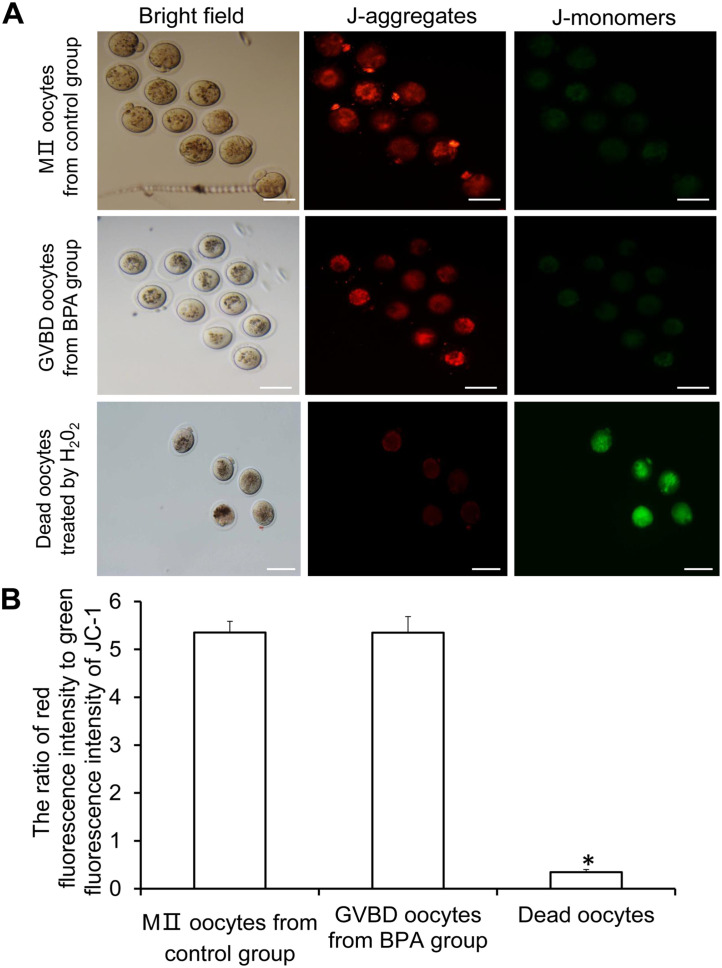
Figure 8.
Mitochondrial membrane potential of oocytes after GVBD and MII-stage oocytes in the BPA group. (A) The representative images of JC-1 staining. J-aggregates produce red fluorescence while J-monomers exhibit green fluorescence. Scale bar = 80 µm. (B) Ratio of red fluorescence intensity to green fluorescence intensity of JC-1.
Compared with GVBD and MII, *P < 0.05.

