Figure 3.

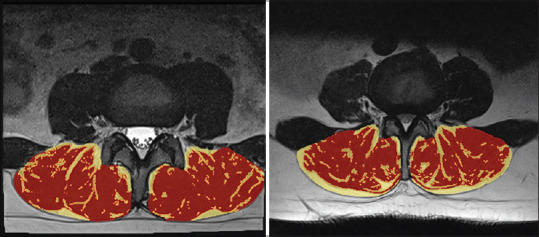
Slicer three-dimensional muscle and fat measurement on axial magnetic resonance image of two different cases. Red areas represent muscle tissue, while yellow areas represent fat tissue.

Slicer three-dimensional muscle and fat measurement on axial magnetic resonance image of two different cases. Red areas represent muscle tissue, while yellow areas represent fat tissue.