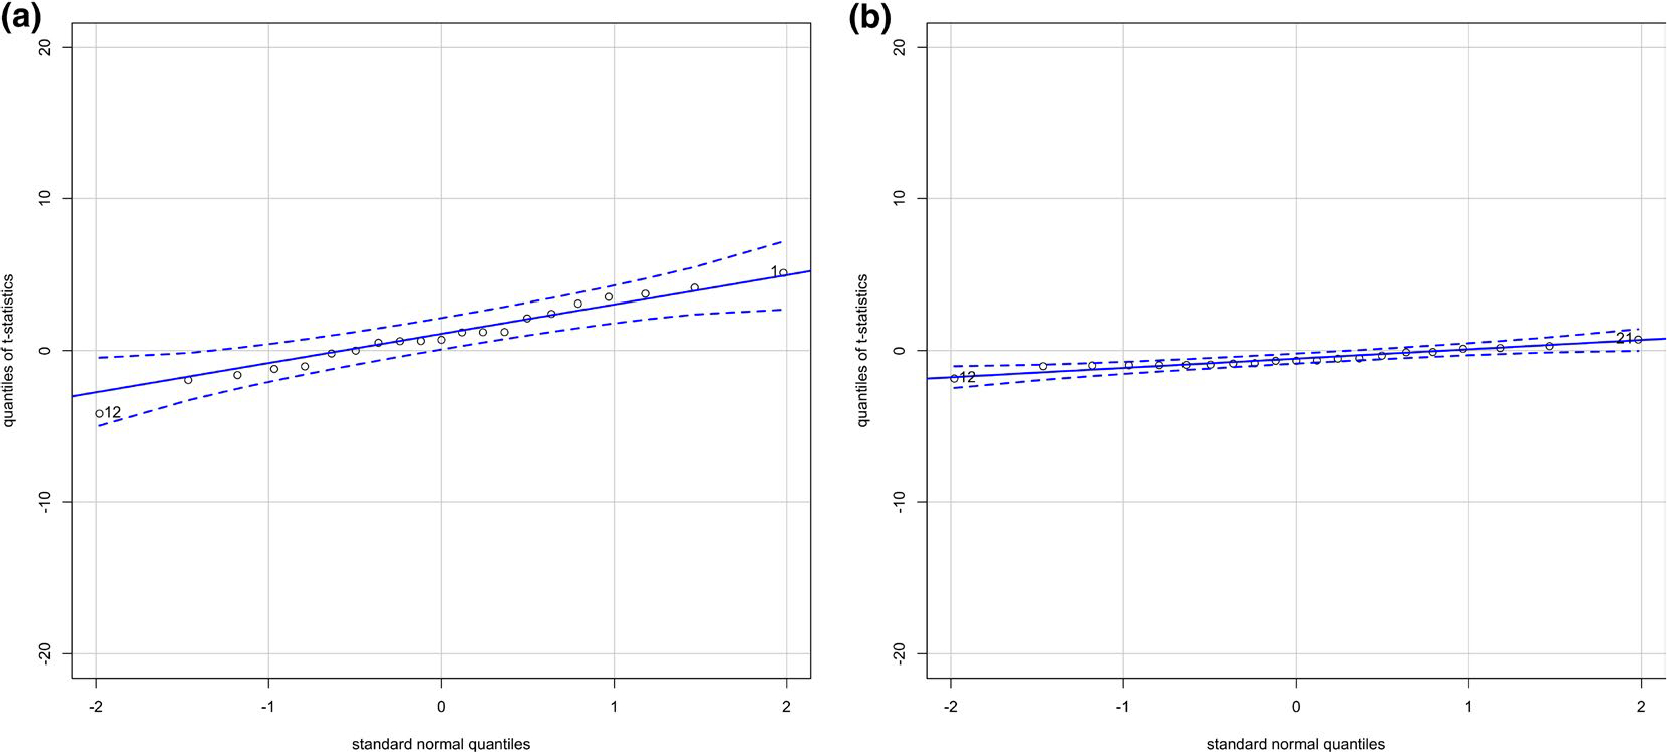
FIGURE 4.

Standard normal quantile plots of t-statistics for the coefficient of log of gestational alcohol exposure in the models predicting each covariate including the square of the number of prenatal visits and the gestational age at screening, (a) Without controlling for the estimated propensity score and (b) Controlling for the estimated propensity score
