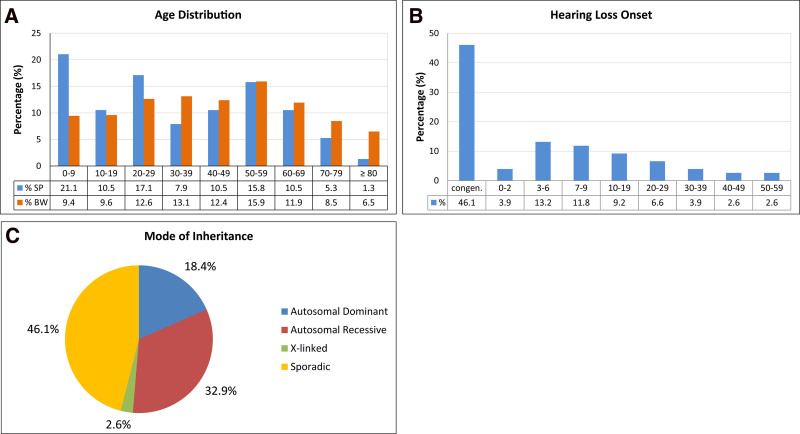
Fig. 1.
Demographic and phenotypic characteristics of the genetic cochlear implant cohort. A, Age distribution of the study population (SP) (n = 76) across all age groups in decades (blue bars). The percentage for each decade is shown below the bar. The age distribution of the cohort (2021) was compared to the age distribution of the population in southwest Germany (BW) for similar reference years (2019) and decades (data from State Statistical Office Baden-Württemberg 2021) (orange bars). B, Age-related distribution of hearing loss onset in the genetic cochlear implant cohort. The phases of congenital onset and prelingual (0–2 years) and perilingual (3–6 years) hearing loss onset are shown in the first three bars (≤6 years). Postlingual hearing loss onset (>6 years) starts at the second bar (7–9 years) and continues through subsequent decades. The percentage for each time window is shown below the bar. C, Overview of the modes of inheritance in the total patient cohort. Pie chart showing the respective proportions of patients with autosomal-dominant, autosomal-recessive, and X-linked inheritance patterns, as well as patients with sporadic hearing impairment.

