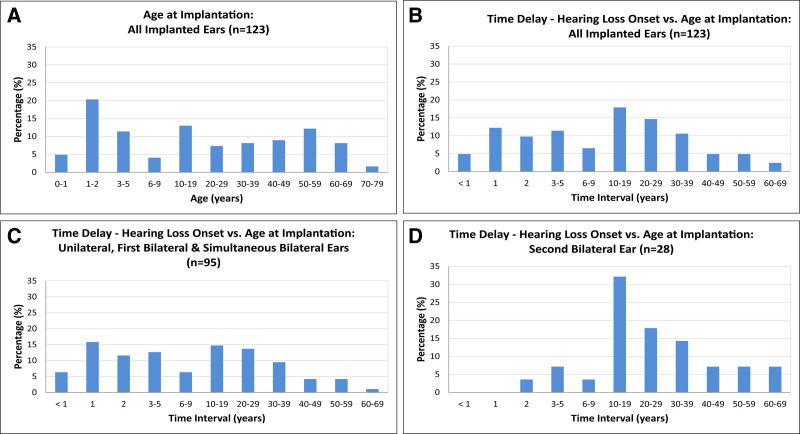
Fig. 3.
Distribution of age at implantation and time delay between hearing loss onset and age at cochlear implantation. A, Distribution of age at cochlear implantation of all implanted ears (n = 123). Phases of early implantation at prelingual age are shown in the first two bars (0–1 and 1–2 years). Implantation at perilingual age is shown in the third bar (3–5 years). Implantation in late childhood (6–9 years) is shown in the fourth bar. Further distribution of age at implantation is shown in decades. Impacts of phenotypic characteristics on diagnostic solution rates. B, Time delay between hearing loss onset and age at cochlear implantation for all implanted ears (n = 123). C, Time delay between hearing loss onset and age at cochlear implantation for all unilateral implanted ears, first implanted ears in sequential bilateral implantations and simultaneous bilateral implantations (n = 95). D, Time delay between hearing loss onset and age at cochlear implantation for second implanted ears in sequential bilateral implantations (n = 28).

