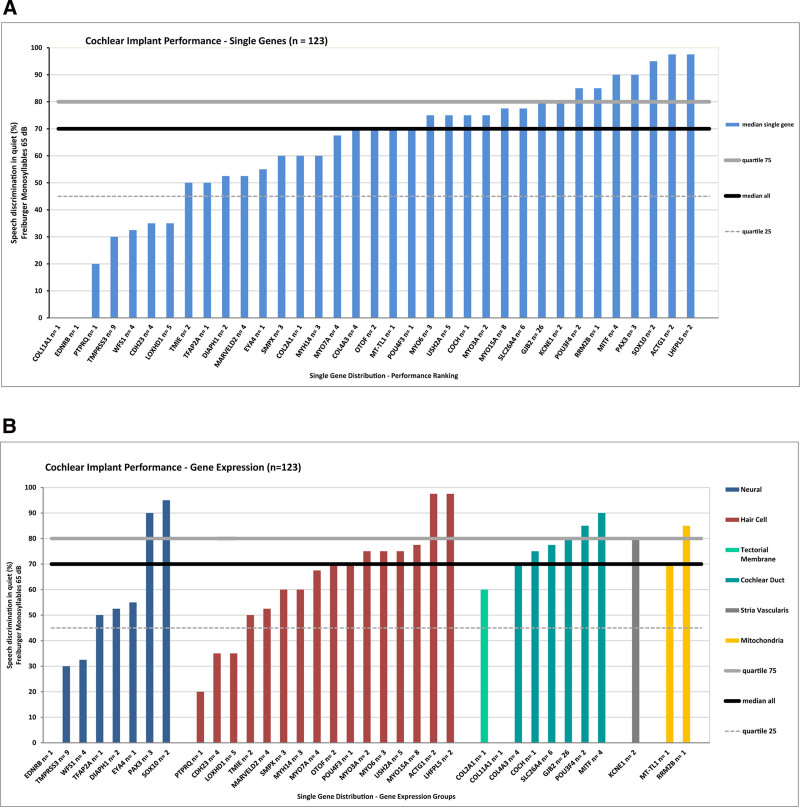
Fig. 4.
Cochlear implant performance for single genes according to the word recognition scores in the Freiburger monosyllabic speech intelligibility test at 65 dB SPL (WRS65). A, Performance ranking for all single genes (n = 35). B, Performance ranking of single genes within five different gene expression groups according to the localization gene expression within the cochlea designated (1) Neural, (2) Hair Cell, (3) Cochlear Duct and Tectorial Membrane, (4) Stria Vascularis, and (5) Mitochondria. The black solid line shows the median of the overall cohort at 70%, the gray solid line shows the upper (80%) quartile, and the gray dashed line shows the lower quartile (45%).

