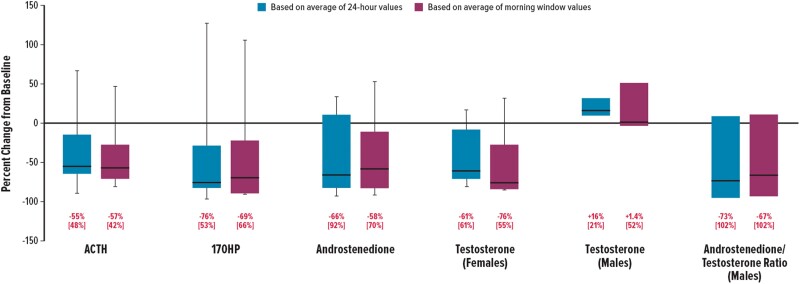
Figure 3.
Percent reductions from baseline to day 14. Boxes represent the IQR: lower edge (25th percentile), upper edge (75th percentile), horizontal bar (median). Whiskers extend beyond the box to the minimum and maximum values. Data below represent median [IQR] values, except for the testosterone and androstenedione/testosterone ratio in males, where data represent median [minimum and maximum] values (n = 3). 17OHP, 17-hydroxyprogesterone; ACTH, adrenocorticotropic hormone; IQR, interquartile range.

