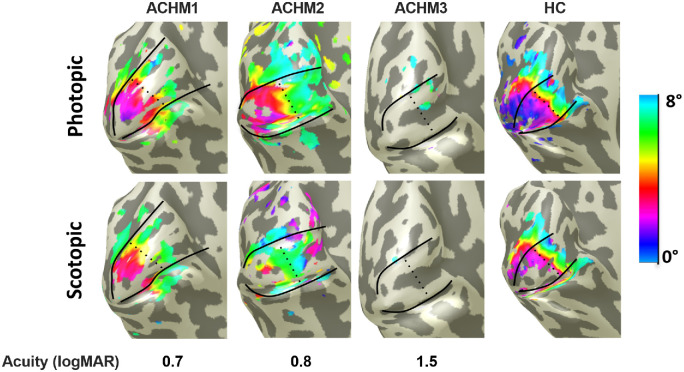
Figure 2.
Eccentricity representations in V1 under different luminance levels derived from conventional phase-encoded eccentricity mapping for three representative participants with achromatopsia (ACHM) and a healthy control participant (HC). All maps are projected onto the left hemisphere of an inflated 3D mesh of the occipital lobe; the boundaries of V1, with atlas-based subdivisions of central and paracentral representations, are outlined in black. Data were thresholded at a coherence value ≥0.25, corresponding to P < 0.0001.57

