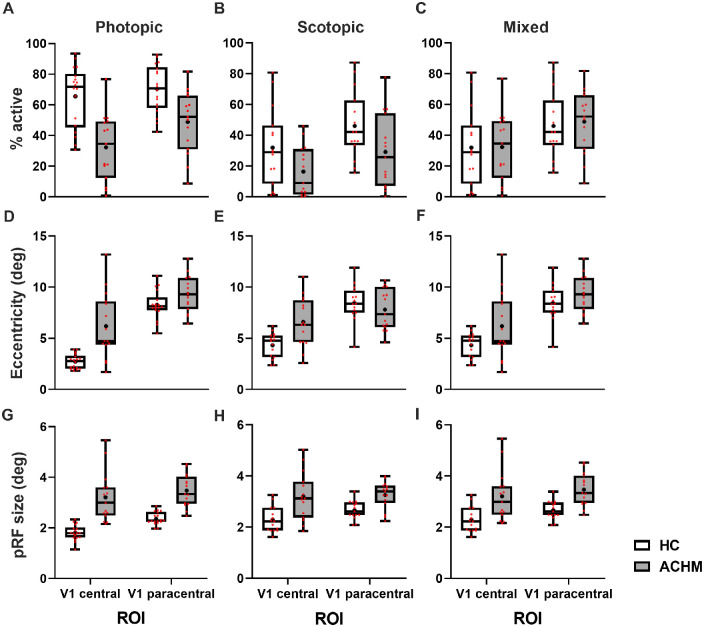
Figure 3.
Population receptive field estimates in central and paracentral portions of V1 in HC and ACHM participants. Top row: Percentage of active voxels: (A) depicts visual cortical estimates derived under photopic conditions while (B) represents the percentage of V1 responding under scotopic conditions. In (C), luminance conditions are mixed and the percentage of V1 responding of controls under scotopic conditions is contrasted with the percentage of V1 responding within the respective ROI of ACHM derived under photopic conditions. Middle row: Mean eccentricity (in degrees) of ROIcentral and ROIparacentral in V1 shown for both participant cohorts under photopic (D), scotopic (E), and mixed (F) luminance conditions. Bottom row: Mean pRF size (in degrees) ROIcentral and ROIparacentral in V1 shown for both participant cohorts under photopic (G), scotopic (H), and mixed (I) luminance conditions. See text for details and statistics. Whiskers present minimum and maximum values, while the box extends from the 25th to 75th percentiles. Median and mean are shown by a solid line and a +, respectively; individual data points are shown in red; sample sizes: NHC (photopic/scotopic) = 18/16; NACHM (photopic/scotopic) = 15/15.

