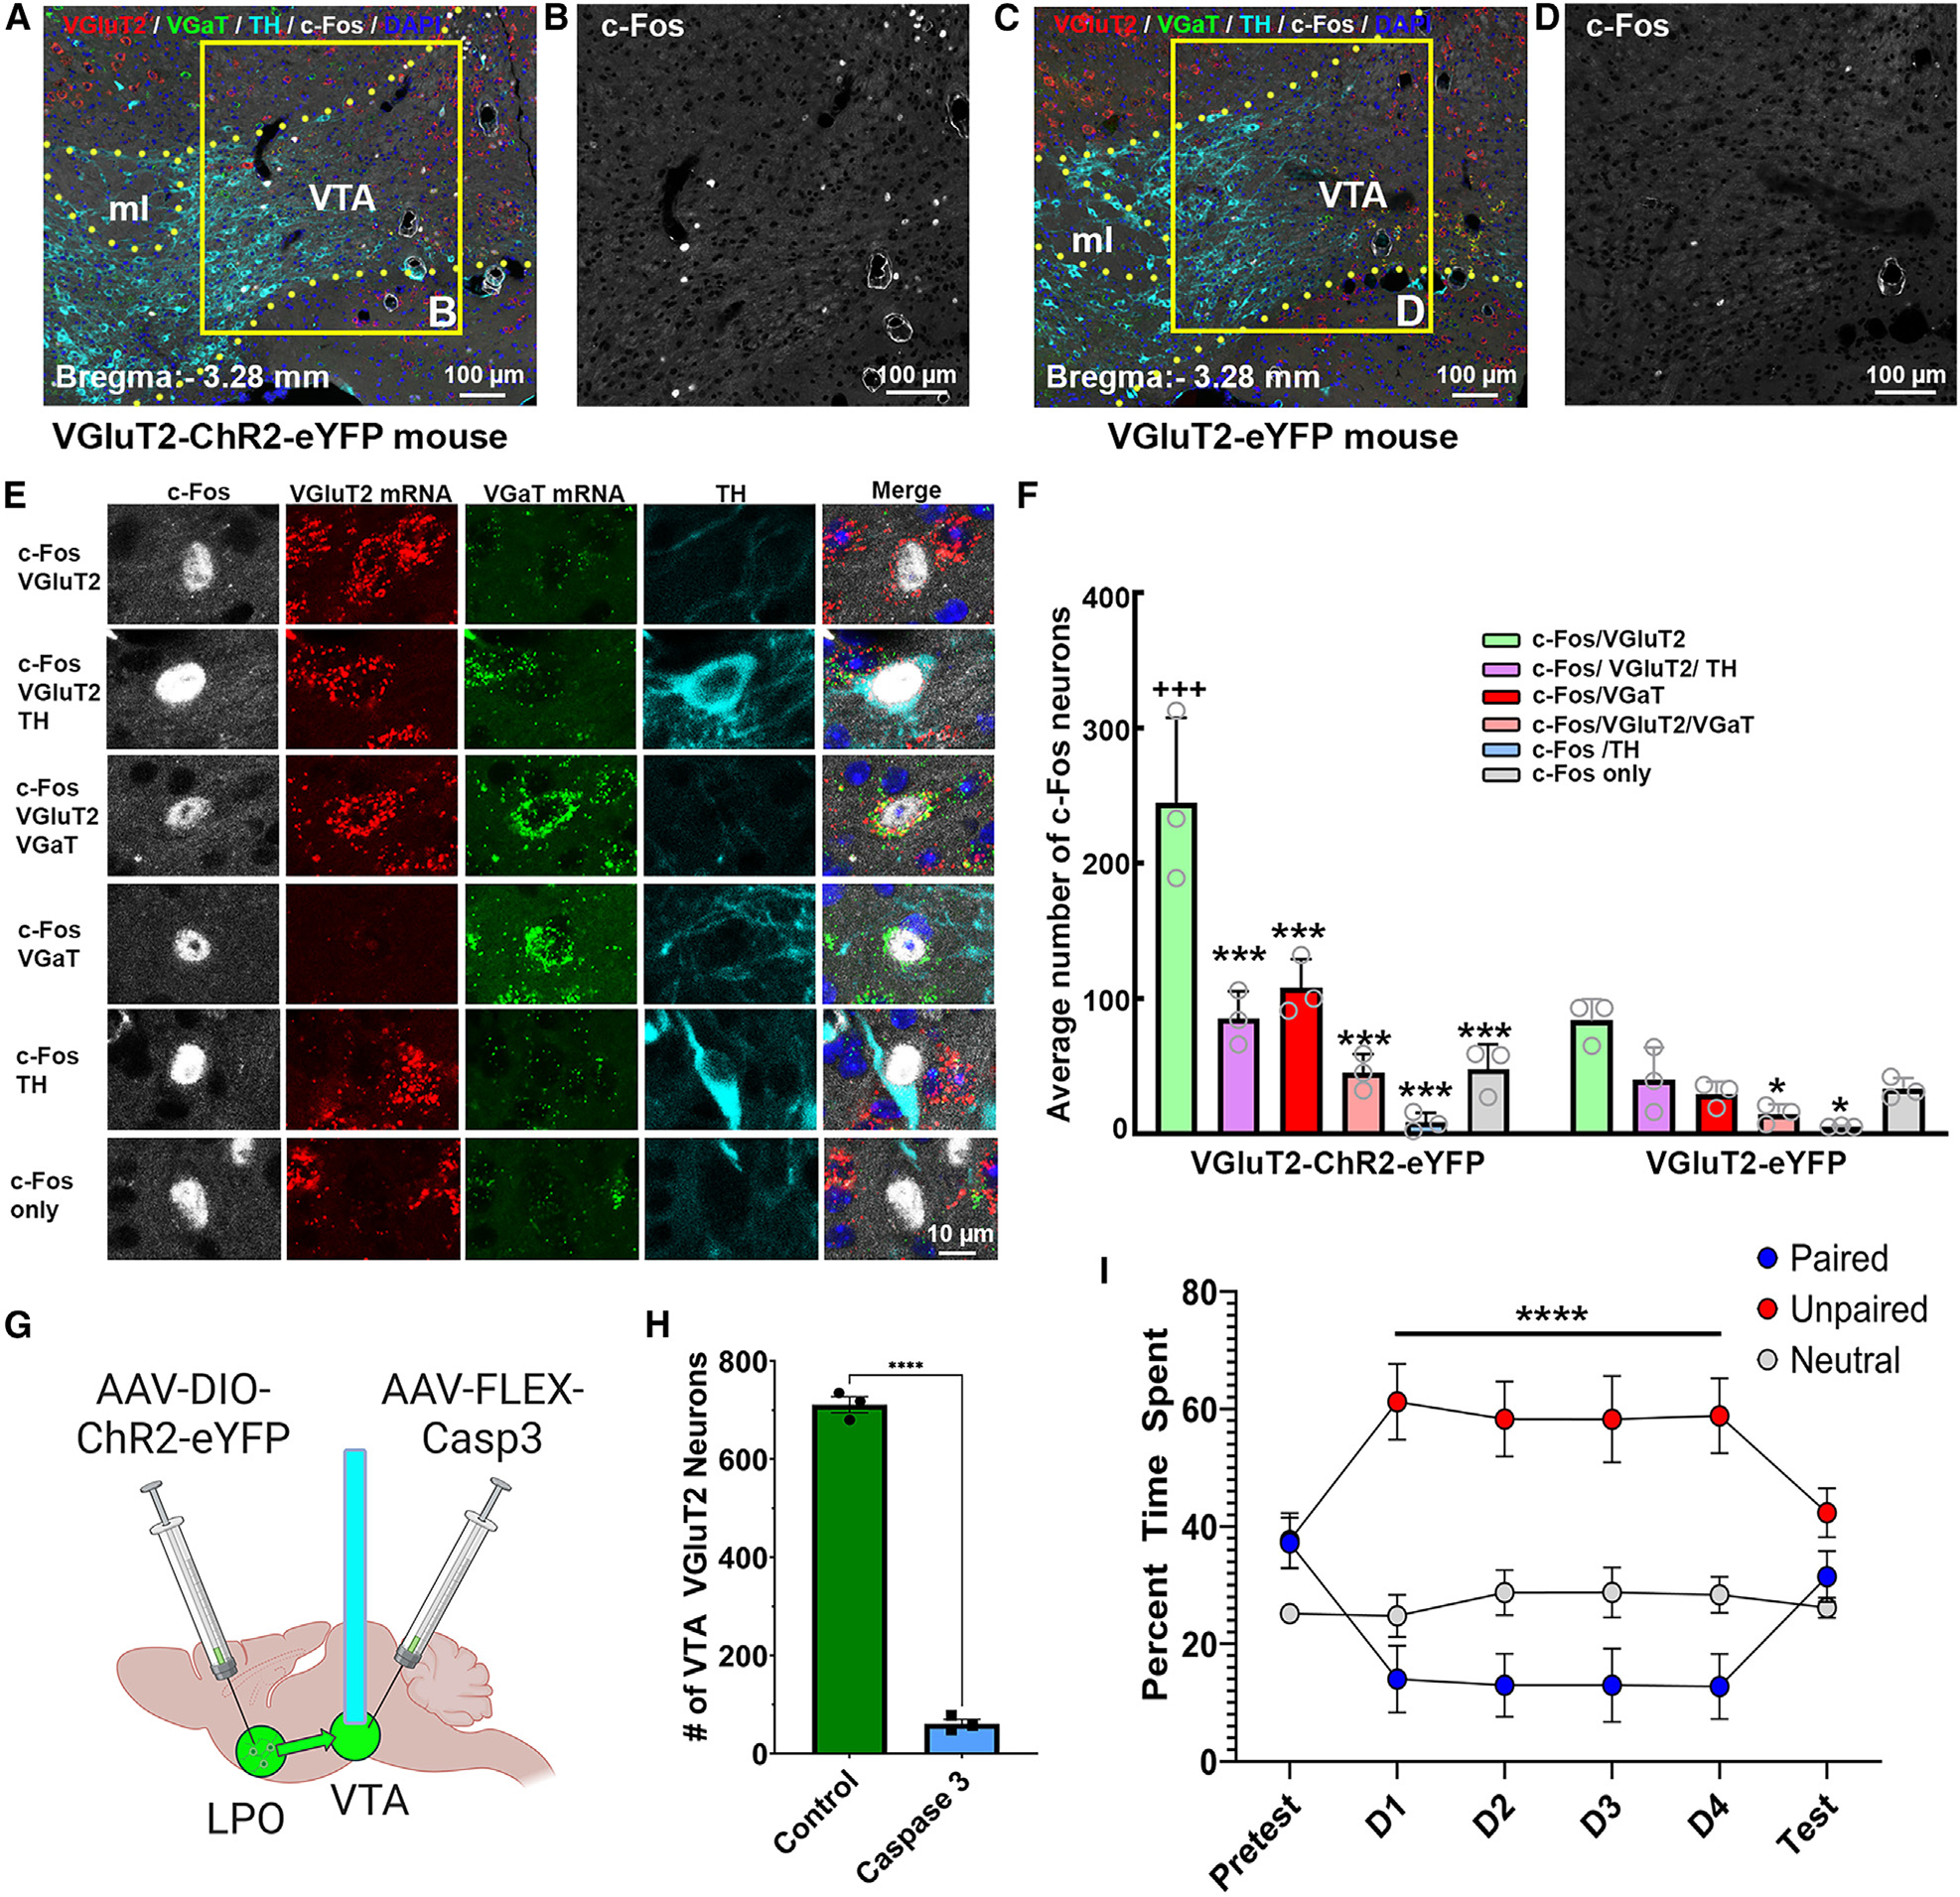
Figure 4. LPO glutamate inputs to the VTA signal aversion through non-glutamatergic neurons.

(A–D) c-Fos expression (white nuclei) induced by VTA photostimulation of LPO VGluT2 fibers in naive VGluT2-ChR2-eYFP mice (A and B) or VGluT2-eYFP mice (C and D). VTA, ventral tegmental area; ml, medial lemniscus.
(E) Phenotype of c-Fos neurons. From top to bottom: neuron coexpressing c-Fos and VGluT2 mRNA (c-Fos/VGluT2); neuron coexpressing c-Fos, VGluT2 mRNA, and TH (c-Fos/VGluT2/TH); neuron coexpressing c-Fos, VGluT2 mRNA, and VGaT mRNA (c-Fos/VGluT2/VGaT); neuron coexpressing c-Fos and VGaT mRNA (c-Fos/VGaT); neuron coexpressing c-Fos and TH (c-Fos/TH); and neuron lacking VGluT2, VGaT, and TH (c-Fos only).
(F) The population of VTA neurons expressing c-Fos was higher in ChR2-eYFP mice (359.7 ± 11.3; n = 3, 15 sections/mouse) than in eYFP mice (206.0 ± 16.8; n = 3, 15 sections/mouse; t(4) = 16.49, p < 0.0001, t test). Within the VTA of ChR2-eYFP mice, most c-Fos neurons coexpressed VGluT2 mRNA (245.00 ± 36.3; 735 neurons), some coexpressed VGluT2 and TH (85.33 ± 11.57; 256 neurons) or VGluT2 and VGaT (45.33 ± 7.80; 136 neurons) or VGaT (107.67 ± 12.44; 323 neurons), fewer coexpressed TH (8.33 ± 4.10, 25 neurons), and some lacked VGluT2, VGaT, and TH (48.00 ± 10.50, 144 neurons; cell type: F(5,20) = 29.07, p < 0.00001, ANOVA with Newman-Keuls post hoc test). Significant difference from c-Fos/VGluT2 neuronal subtype: ***p < 0.001, *p < 0.05. Difference from eYFP mice: +++p < 0.001.
(G) Diagram of virus injection (AAV5-EF1α-DIO-ChR2-eYFP) in the LPO and VTA (AAV1-FLEX-Casp3) for the VTA ablation of vglut2 neurons and VTA photostimulation of LPO-VGluT2 fibers in VTA.
(H) The AAV encoding caspase 3 in the VTA reduced the number of VTA vglut2 neurons (t(4) = 35.08, ****p < 0.0001).
(I) Despite lesioning ~92% of VTA VGluT2 neurons, optogenetic stimulation of LPO-VGluT2 neurons innervating the VTA continued to drive aversion toward the paired chamber (chamber × session, F(10, 144) = 4.60, p < 0.0001). Significant difference from unpaired chamber: ****p < 0.001; all data represent mean ± SEM.
